Let’s dive into a detailed technical analysis of the ETH/USDT chart on the 1-day timeframe, as shown in the image. This analysis will cover price action, moving averages, volume, MACD, and RSI indicators to provide a comprehensive view of the current market situation for Ethereum (ETH) against Tether (USDT) on Binance.
1. Price Action and Trend Analysis
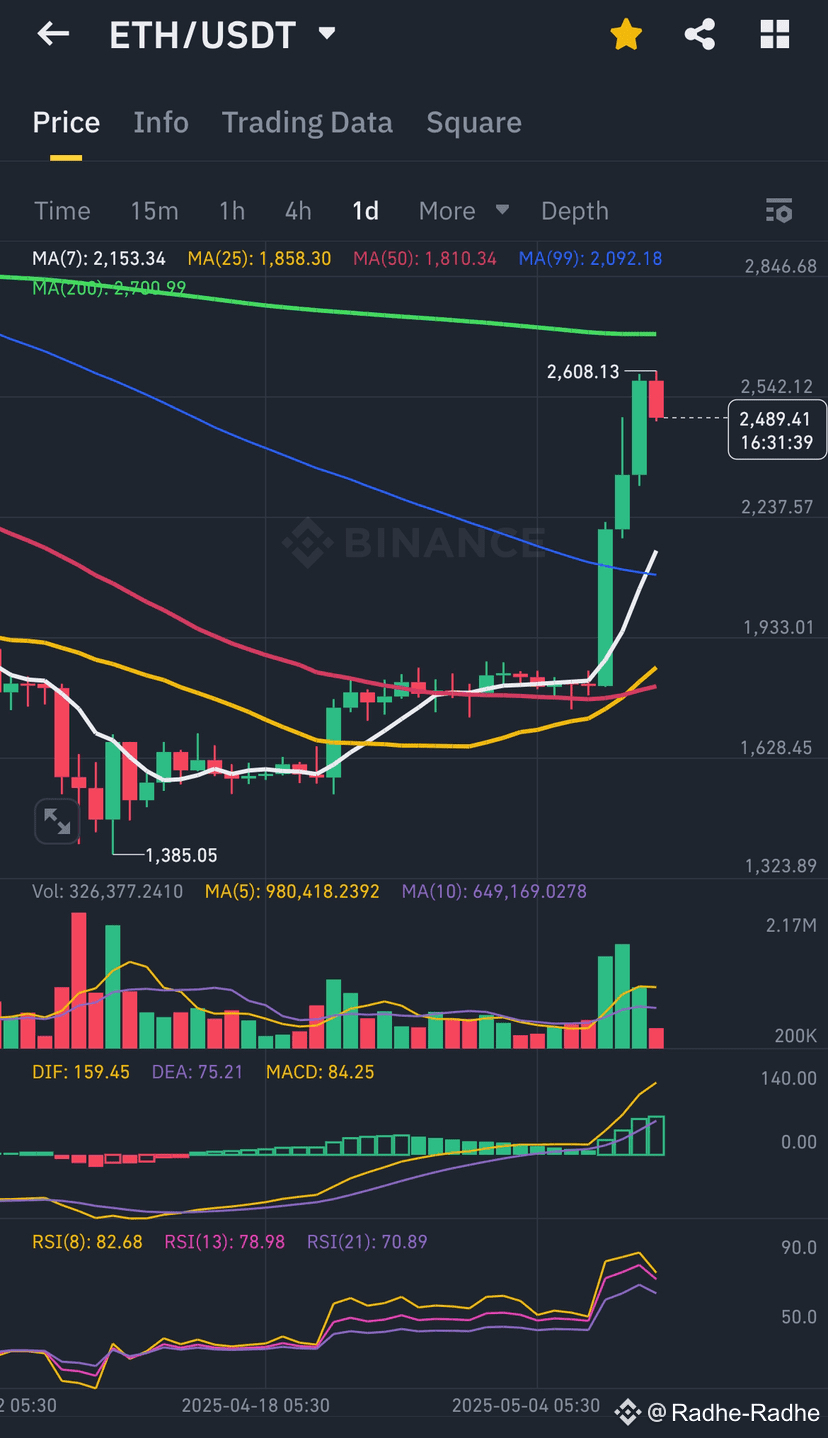
The chart shows ETH/USDT over a period from mid-April to early May 2025. Here’s what we observe:
• Recent Price Movement: The price has recently surged from around 1,923.01 to a high of 2,608.13, followed by a slight pullback to 2,484.94. The latest candle shows a strong bullish move, closing at 2,489.41, indicating a 29.4% increase over this period.
• Trend: The overall trend appears to have shifted from a downtrend to a potential uptrend. Prior to the recent surge, the price was in a consolidation phase between 1,838.05 and 1,923.01, with a slight downward bias. The breakout above 2,000 and the subsequent rally suggest a trend reversal.
• Support and Resistance:
◦ Support: The recent consolidation zone around 1,838.05 to 1,923.01 acts as a strong support level. If the price pulls back, this area may hold.
◦ Resistance: The recent high of 2,608.13 is a key resistance level. The price is currently testing this zone, and a break above could signal further upside toward 2,846.68 (a psychological level mentioned on the chart).
2. Moving Averages (MA) Analysis
The chart includes several moving averages (MA7, MA25, MA50, MA99, MA200), which help identify the trend and potential crossover signals:
• MA(7): 2,153.34 (Yellow line)
• MA(25): 1,858.30 (Red line)
• MA(50): 1,810.34 (Blue line)
• MA(99): 2,092.18 (Green line)
• MA(200): 2,700.99 (White line)
Observations:
• Short-Term MAs (MA7, MA25): The price has surged above both the MA7 and MA25, indicating short-term bullish momentum. The MA7 (2,153.34) is now acting as immediate support, and the price is well above the MA25 (1,858.30), confirming the bullish trend in the short term.
• Medium-Term MAs (MA50, MA99): The price has also broken above the MA50 (1,810.34) and MA99 (2,092.18), which further strengthens the bullish case. The MA50 and MA99 are sloping upward, suggesting that the medium-term trend is turning bullish.
• Long-Term MA (MA200): The MA200 at 2,700.99 is still above the current price. This level acts as a long-term resistance. Historically, the MA200 is a significant indicator of the overall trend, and a break above it would confirm a long-term bullish trend.
• Golden Cross Potential: The MA50 (1,810.34) has crossed above the MA99 (2,092.18), and the MA25 is also trending upward. If the MA50 crosses above the MA200 in the future, it would form a “Golden Cross,” a strong bullish signal.
Interpretation:
The price breaking above the short- and medium-term MAs is a bullish signal. However, the MA200 at 2,700.99 remains a critical level to watch. A sustained move above this level would confirm a long-term bullish trend.
3. Volume Analysis
Volume is a key indicator of the strength of a price move. The chart shows:
• Volume: 326,377.2410 ETH
• MA(5): 980,418.2392
• MA(10): 649,169.0278
Observations:
• The recent price surge is accompanied by a significant spike in volume, as seen in the tall green volume bars. This indicates strong buying pressure and confirms the validity of the breakout.
• The volume is above both the MA(5) and MA(10), suggesting that the current move is supported by higher-than-average trading activity.
• Prior to the breakout, volume was relatively low during the consolidation phase, which is typical before a significant move.
Interpretation:
The high volume during the breakout is a bullish sign, as it shows strong market participation. However, traders should watch for a potential decrease in volume on pullbacks, which could indicate weakening momentum.
4. MACD (Moving Average Convergence Divergence) Analysis
The MACD indicator is shown below the price chart with the following values:
• DIF: 159.45
• DEA: 75.21
• MACD: 84.25
Observations:
• The MACD line (DIF) is above the signal line (DEA), which is a bullish signal.
• The MACD histogram (MACD value) is positive at 84.25, indicating that the bullish momentum is increasing.
• The MACD line and signal line are both trending upward, and the gap between them is widening, which suggests that the bullish trend is gaining strength.
Interpretation:
The MACD confirms the bullish momentum in the market. The widening gap between the DIF and DEA, along with a positive histogram, indicates that the upward move may have more room to run. However, if the histogram starts to shrink, it could signal a potential slowdown in momentum.
5. RSI (Relative Strength Index) Analysis
The RSI indicator is shown at the bottom of the chart with the following values:
• RSI(8): 82.68
• RSI(13): 78.98
• RSI(21): 70.89
Observations:
• All RSI values are above 70, which indicates that ETH/USDT is in overbought territory.
• The RSI(8) at 82.68 is particularly high, suggesting that the price may be overextended in the short term.
• The RSI(13) and RSI(21) are also elevated but slightly lower, showing that the overbought condition is consistent across different timeframes.
Interpretation:
The RSI being in overbought territory (above 70) suggests that the price may be due for a pullback or consolidation in the near term. While overbought conditions can persist in strong trends, they often precede a correction. Traders should be cautious of a potential reversal or retracement, especially if the RSI starts to diverge (e.g., if the price makes a higher high but the RSI makes a lower high).
6. Key Levels to Watch
Based on the chart, here are the critical levels to monitor:
• Support Levels:
◦ Immediate Support: 2,153.34 (MA7)
◦ Strong Support: 1,923.01 to 1,838.05 (previous consolidation zone)
• Resistance Levels:
◦ Immediate Resistance: 2,608.13 (recent high)
◦ Next Resistance: 2,700.99 (MA200)
◦ Psychological Resistance: 2,846.68 (as mentioned on the chart)
7. Overall Market Sentiment and Trading Strategy
Bullish Factors:
• Strong price breakout above key moving averages (MA7, MA25, MA50, MA99).
• High volume during the breakout, confirming the strength of the move.
• Bullish MACD with a widening gap between the DIF and DEA.
• Upward trend in the medium-term moving averages, indicating a potential trend reversal.
Bearish/Cautionary Factors:
• RSI in overbought territory (82.68 on RSI(8)), suggesting a possible pullback.
• The MA200 at 2,700.99 remains a significant resistance level.
• The recent sharp rally may lead to profit-taking, causing a short-term correction.
Trading Strategy:
1 Bullish Scenario:
◦ If the price breaks above 2,608.13 with strong volume, it could target the MA200 at 2,700.99 and potentially 2,846.68.
◦ Traders could look for a pullback to the MA7 (2,153.34) or MA25 (1,858.30) as an entry point for a long position, with a stop-loss below the support zone (1,923.01).
◦ Target: 2,700.99 or higher if the MA200 is broken.
2 Bearish Scenario:
◦ If the price fails to break 2,608.13 and shows signs of rejection (e.g., a bearish candlestick pattern like a shooting star), a pullback to the support zone (1,923.01 to 1,838.05) is possible.
◦ Traders could wait for confirmation of a reversal (e.g., RSI divergence or a bearish MACD crossover) before entering a short position.
◦ Target: 1,923.01 or lower if the support breaks.
3 Risk Management:
◦ Given the overbought RSI, traders should be cautious of a potential correction. Use tight stop-losses to manage risk.
◦ Monitor volume on pullbacks—decreasing volume on a retracement suggests a healthy correction, while increasing volume on a drop could signal a stronger reversal.
8. Conclusion
The ETH/USDT chart shows strong bullish momentum, supported by a breakout above key moving averages, high volume, and a bullish MACD. However, the overbought RSI suggests caution, as the price may be due for a pullback or consolidation. The key level to watch is the MA200 at 2,700.99—a break above this level would confirm a long-term bullish trend, while failure to break it could lead to a retracement to the support zone around 1,923.01.
For now, the trend is bullish, but traders should remain vigilant for signs of a reversal, especially given the overbought conditions.
