#MarketPullback #PhanTichKyThuat
LAYER/USDT is undergoing a strong correction, with a decrease of more than 41% from the recent peak. Below is a detailed analysis across time frames to assess the trend and propose suitable trading strategies.


1. Summary of technical data by time frame
5-minute frame
Price: ~1.7000
EMA: Converging lines – potential short-term reversal signal
RSI: 66.9 (overbought)
MACD: Slightly Positive
Volume: Low (34.7K)
15-minute frame
Price: 1.6997
EMA: 7 < 25 < 99 – Clear downtrend
RSI: Neutral, not oversold
MACD: Slightly Positive – weak signal
Volume: Low (103K)
1-hour frame
Price: 1.6996
EMA: 7 < 25 < 99 – Downtrend continues
RSI: 23.7 – Oversold area
MACD: Negative but improving
Volume: Average (1.22M)
4-hour frame
Price: 1.6964
EMA: 7 < 25 < 99 – Strong decline
RSI: 4.73 – Extremely low level, indicating potential bottom
MACD: -0.1720 – Strong downtrend
Volume: High (1.22M)
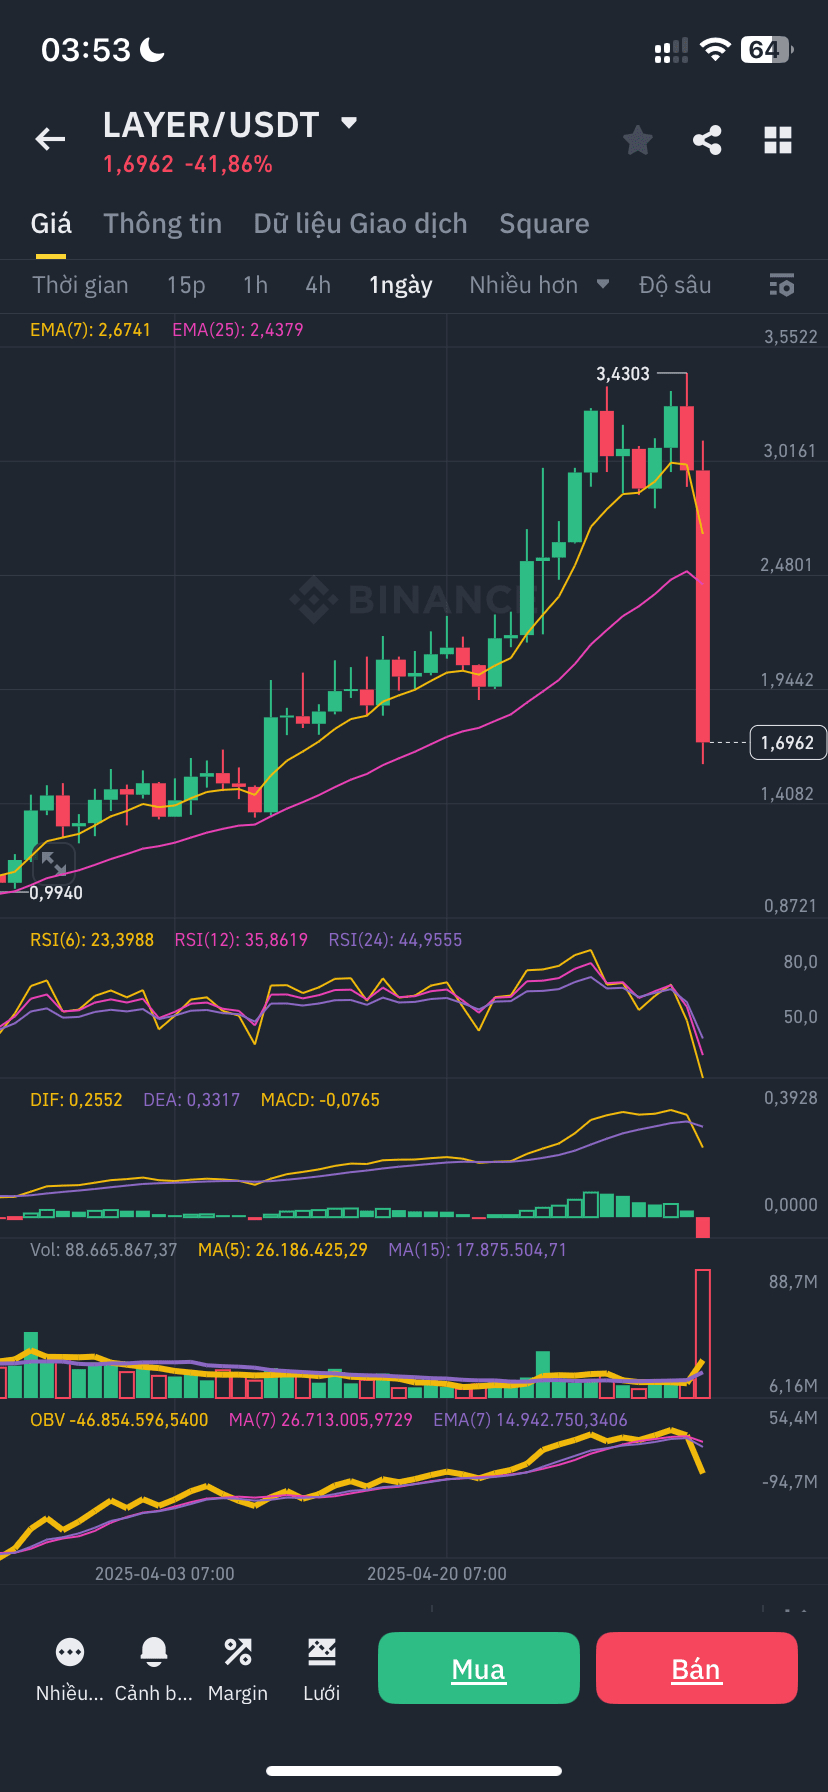
1-day frame
Price: 1.6962
EMA: 7 > 25 – Short-term divergence
RSI: 23.39 – Oversold area
MACD: Slightly Negative – improving
Volume: Very high (88.7M)
2. Overview analysis
Main trend: Strongly bearish in both medium and long term (EMA across all frames is arranged bearish).
Short-term reversal signal: RSI in 1h and 4h frames reached deep oversold area, combined with improving MACD – a technical bounce may occur.
Volume: Strongly increasing in daily frame – may be a sign of forming a mid-term bottom.
3. Proposed trading scenarios
Scenario 1 – Cautious (probability 60-65%)
Entry point: 1.7050 (when price exceeds EMA7 in 15-minute frame with increasing volume)
Stop Loss: 1.6800
Take Profit: 1.7500 (EMA25 in 1h frame)
R:R ratio: About 1:3
Scenario 2 – Risky (probability 50-55%)
Entry point: Right at the current area (~1.6960)
Stop Loss: 1.6500
Take Profit: 1.8000 (psychological resistance)
R:R ratio: About 1:2
4. Risk Management
Capital allocation: No more than 2-5% of total capital
Exit strategy: Consider taking partial profits when reaching 50% of the target
Monitor closely: Volume fluctuations and price behavior around support – resistance areas
Note: The cryptocurrency market is always highly volatile. Technical signals need to be continuously updated. Investors should be ready to adjust strategies as market conditions change.
