Market conditions are becoming increasingly strained in anticipation of the FOMC meeting, as price forecasts for $BTC and leading altcoins indicate a possible downturn due to reduced liquidity.
With less than a day remaining until the Federal Open Market Committee (FOMC) convenes to deliberate on interest rates, the outlook for both global and cryptocurrency markets is becoming markedly pessimistic.
As the U.S. and wider crypto markets experience a temporary decline, the heightened anxiety surrounding the FOMC meeting is expected to lead to a more significant correction in the near future.
Unchanged Rates To Crash Markets U.S. and Crypto Alike
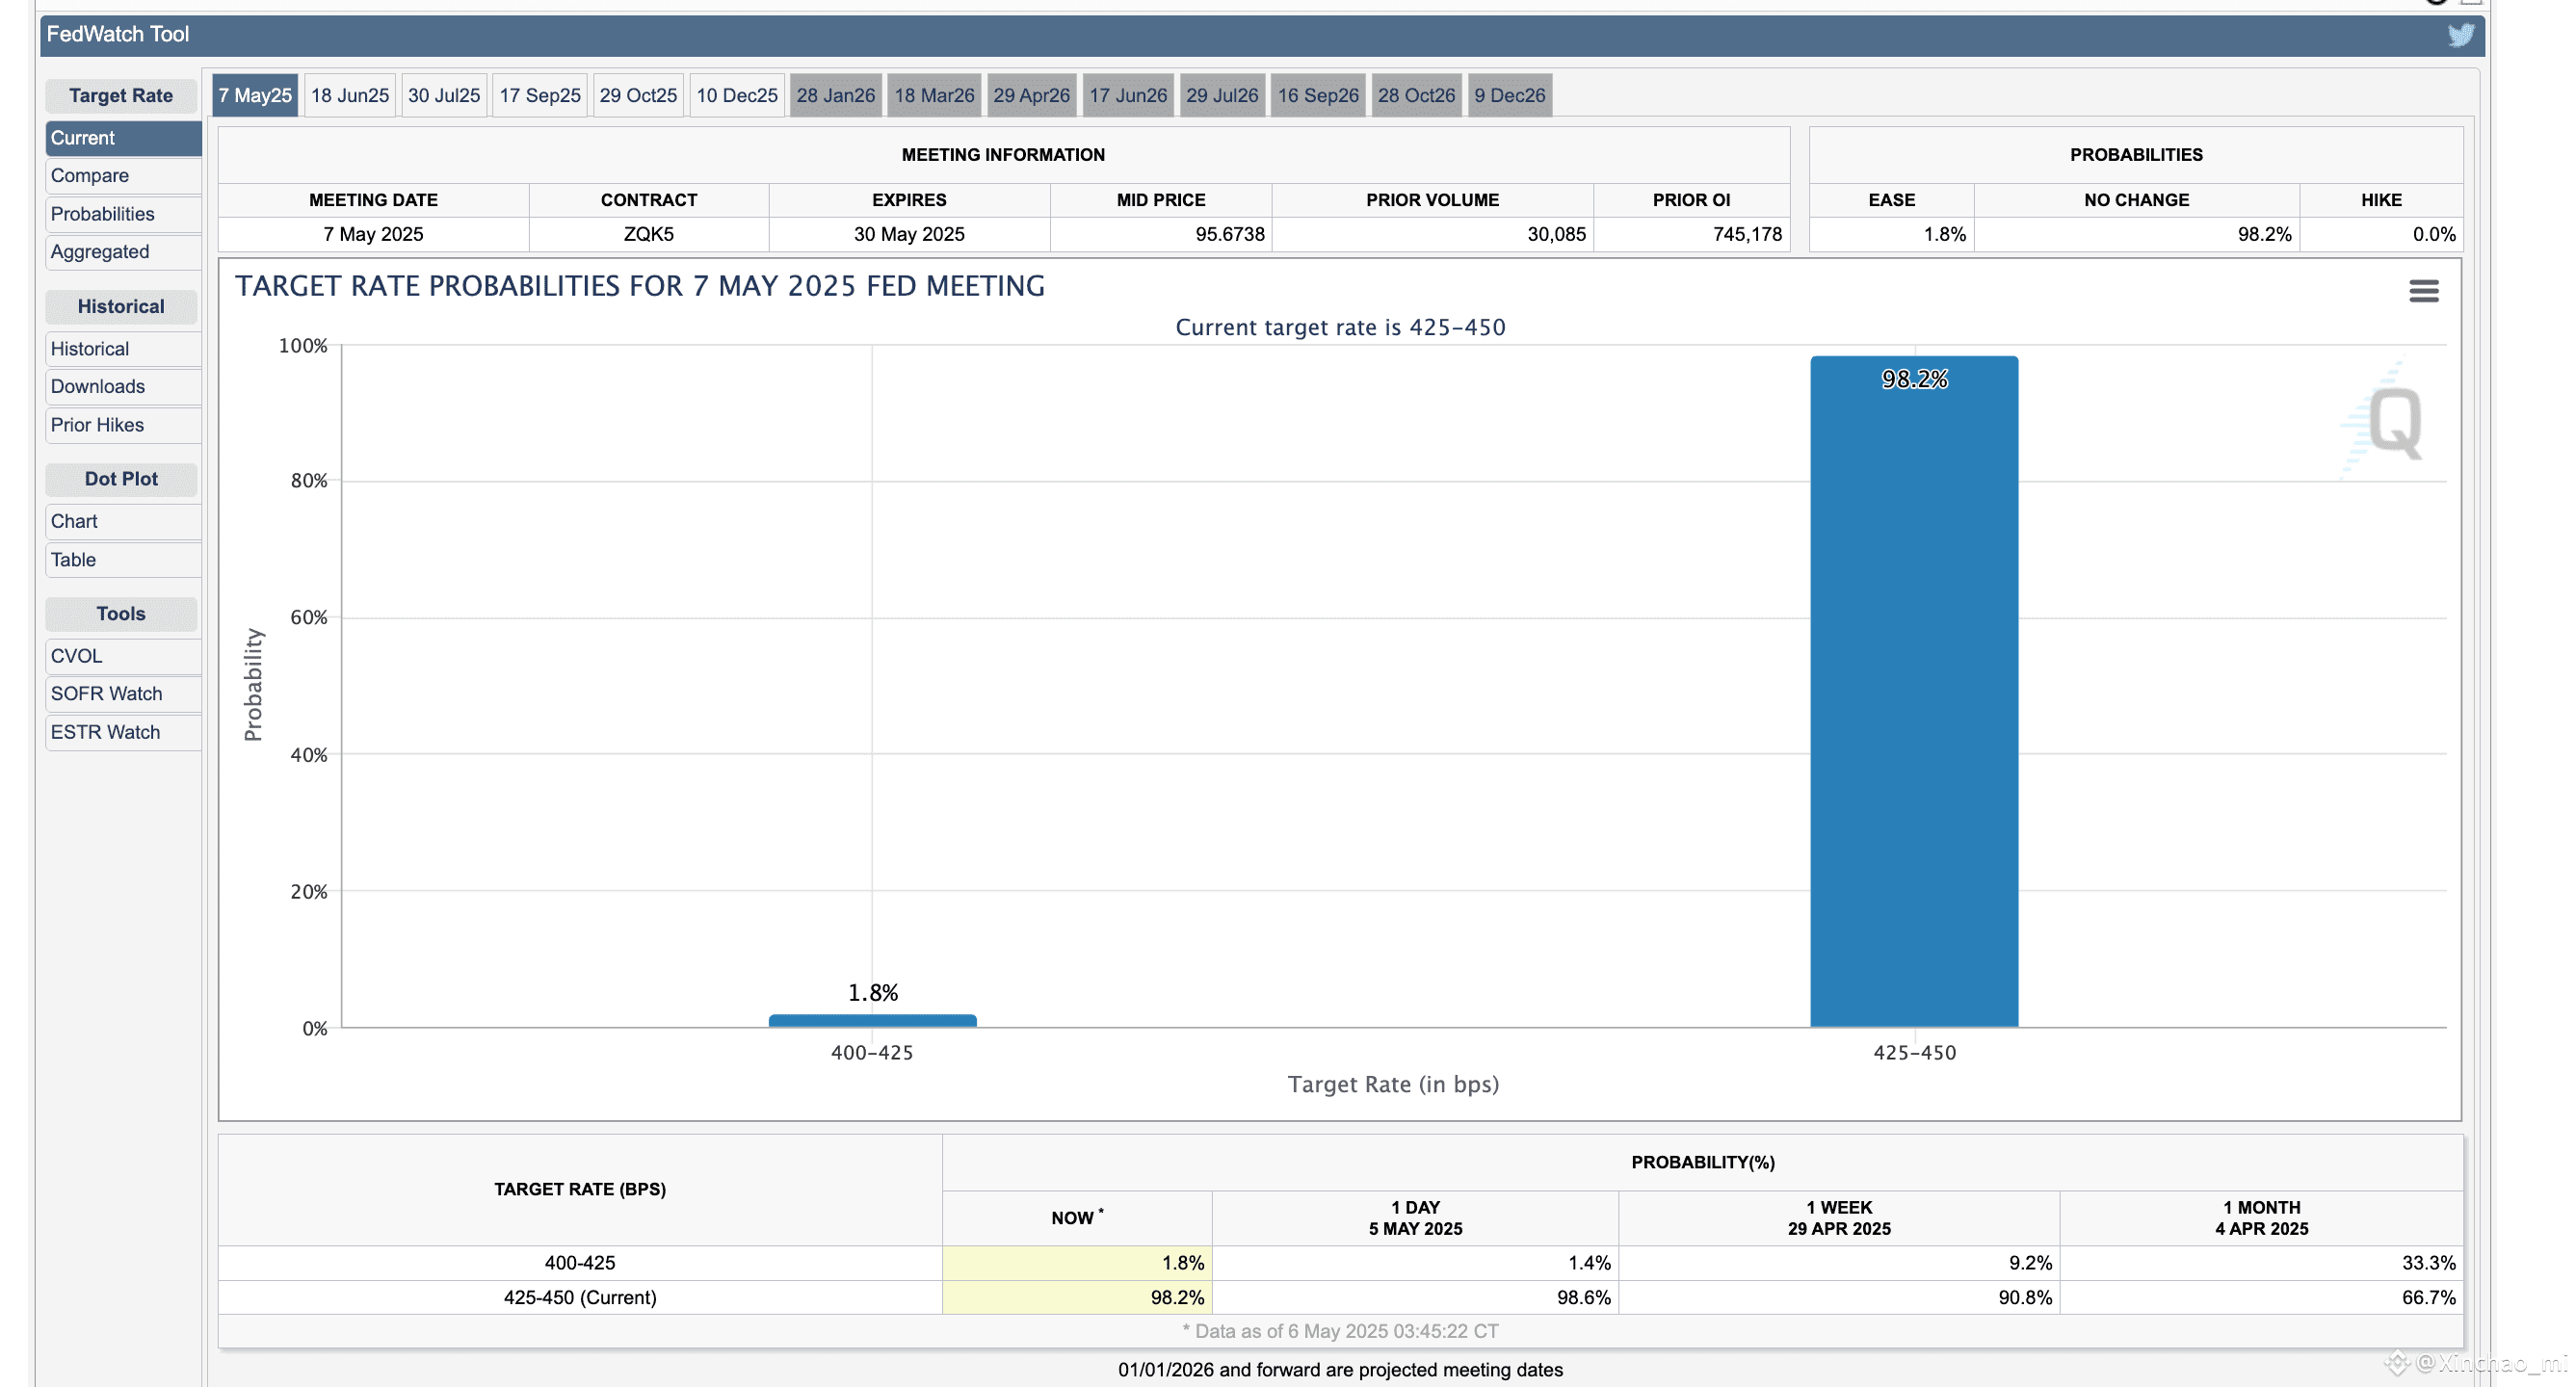
The forthcoming meeting of the Federal Open Market Committee on May 7 will consider the potential for a reduction in interest rates within the US market.
Nevertheless, the FedWatch tool indicates a 98.2% likelihood that the existing rates will stay the same.
Given that the rates are anticipated to stay stable, diminished market liquidity and a lower risk appetite among investors may result in short-term adjustments.
Uncertainty in Dow Jones Index Warns of Correction Ahead
On May 5, the Dow Jones, which represents the leading 30 companies on the US Stock Exchange, experienced a deceleration, resulting in the formation of a doji candle.
The prevailing market uncertainty maintained the Dow Jones marginally above the $41,000 mark.

A decline below the $41,000 threshold will eliminate the possibility of a bullish recovery for the Dow Jones.
According to general market expectations and price forecasts, this is expected to result in a more significant correction across the wider US market.
Bitcoin Could Hit $91k If Bears Take Over
Amid escalating tensions, Bitcoin remains above $94,000, currently priced at $94,200 after a slight intraday decline of 0.61%.

The 50-day and 100-day Exponential Moving Average (EMA) lines indicate a bullish crossover, while the MACD and signal lines reveal a bearish crossover.
As Bitcoin experiences a decline in momentum, the likelihood of a more significant correction increases. According to Fibonacci levels, this downturn implies a Bitcoin price forecast of $87,653.
Ethereum Price Prediction Targets Sharp Correction To $1,577
In light of the increasing bearish pressure, Ethereum is approaching a potential retest of $1,755. The Supertrend indicator cautions that a decline below $1,755 will initiate a new bearish cycle.

The Fibonacci levels indicate that the next significant support is at $1,676, with a subsequent level at $1,577.
Nevertheless, predictions for Ethereum's price imply a possible increase to $1,855 if the bulls maintain their position at $1,755.
Binance Token Under $600 to Experience Steeper Correction
The BNB token faces significant risk as it is currently trading below the recently breached $600 mark.
Additionally, a persistent resistance trend line indicates a bearish trend may persist if the decline continues.

The forecast for Binance Coin indicates a potential revisit to $554, subsequently followed by $531.
Nevertheless, should an unexpected breakout occur along the trendline, the price of BNB could ascend to the nearest resistance level at $637.
Bearish Streak in XRP Price to Break $2, Sellers Target $1.79
The price of XRP has experienced four consecutive days of decline, resulting in a nearly 5% decrease.
At present, XRP is facing challenges in maintaining its position above the psychological threshold of $2 due to increasing selling pressure.

The MACD and signal lines have exhibited a negative crossover. Given that the altcoin is situated within a descending channel pattern, it is probable that the bears will attempt to test the $2 level. Should a prolonged correction occur, the price trend of XRP may reach $1.79.
Dogecoin Price Prediction Warns Near 10% Crash
Dogecoin, the largest memecoin in the market, has recently broken through a short-term support trendline, indicating a possible upcoming correction.
The prolonged correction, known as the breakdown rally, has surpassed the $0.17 threshold.

As the selling pressure grows, Dogecoin price prediction warns of a retest of the $0.1524 support level. This will account for a downside risk of nearly 10%.
Solana Price Trapped in Triangle, Sellers Eye $140
As market volatility increases, Solana remains confined within a symmetrical triangle formation. Nevertheless, the growing bearish sentiment signals a potential significant decline for Solana.

The essential support level for Solana is the 200 EMA at $140. Should this average line fail, the potential downside risk could exceed 11% from the $140 level.
Conversely, if the price of Solana remains above the 100 EMA line, a possible triangle breakout could challenge the $165 level.
SUI Price Prediction Warns 14% Correction Ahead
SUI has decreased by 3.48% today, which diminishes the 4.5% increase observed on May 5. This suggests the possibility of a prolonged correction as market volatility increases.

The SUI token is expected to approach the 200 EMA line around $2.83. Consequently, the SUI price forecast indicates a potential correction exceeding 14%.
The likelihood of a re-test of the 200-day EMA is further supported by a negative crossover observed in the MACD and signal lines.
#CryptoNewss #MarketSentimentToday #MarketUpdates" #news #Price-Prediction