$BTC Bitcoin is trading at $96,101 with a market capitalization of $1.907 trillion. Over the last 24 hours, its trading volume reached $21.413 billion, moving within an intraday range from $95,944 to $97,821.
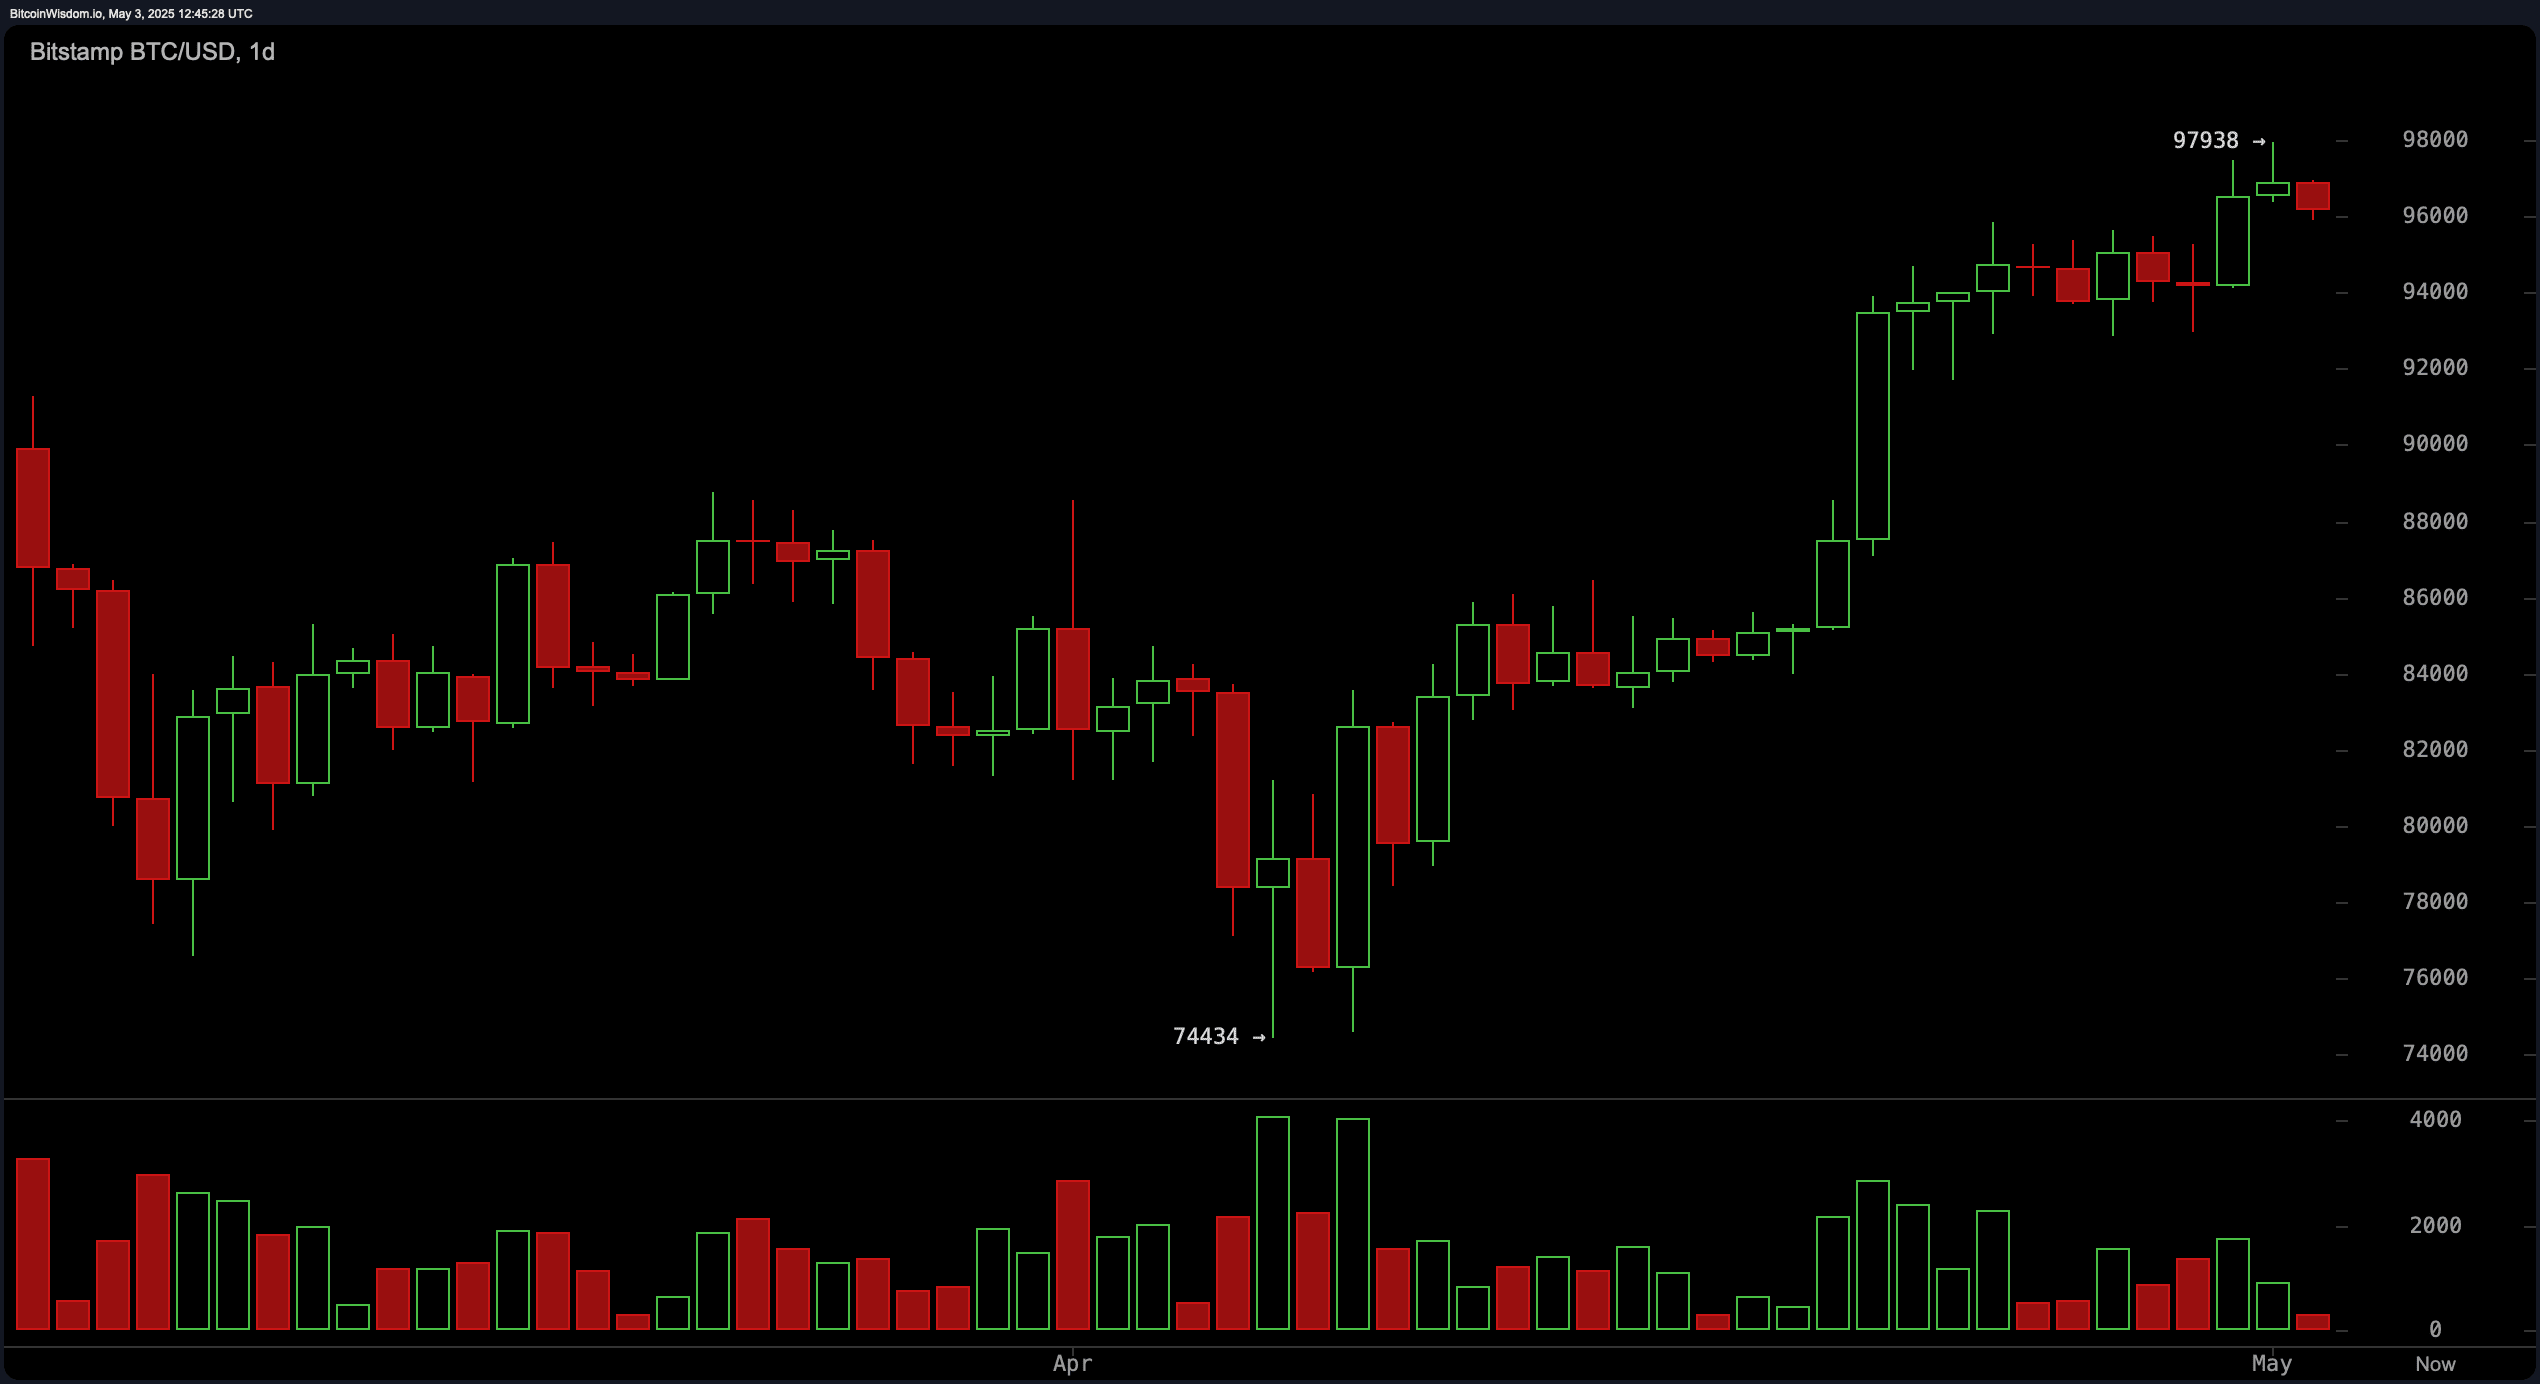
On the daily chart, Bitcoin (BTC) maintains an upward trend, following a steady rise from the $74,434 level to a recent high of $97,938. However, the observed increase in volume during the rise has begun to decline, indicating a possible weakening of bullish momentum. The potential formation of an ascending wedge often signals upcoming reversals. The immediate support zone is between $90,000 and $91,000, with secondary support around $84,000. Traders are advised to watch for a pullback to the $90,000–$92,000 zone for entering long positions, with caution if volume increases below $90,000.
The four-hour chart shows the formation of a sideways market structure since Bitcoin peaked on May 1. Lower highs are being established, indicating a possible beginning of a downtrend, especially given the pronounced red volume bar recorded on May 2, signaling increasing selling pressure. Currently, the price fluctuates between $96,000 and $97,000, representing a zone of market uncertainty. A decisive break above $97,500 with high volume could trigger a short-term upward move, while a break below $96,000 may lead to a pullback to the support level of $94,000.
Short-term signals on the 1-hour chart confirm the bearish outlook. A double top around $97,938.
Bullish Verdict:
Despite signs of short-term exhaustion and consolidation, Bitcoin remains structurally bullish on higher timeframes. Ongoing buy signals from all major moving averages, along with solid support zones and a buy signal from the MACD, suggest that a healthy pullback may precede the next higher phase, especially if buyers regain control above $97,500 with volume.
Bearish Verdict:
Technical data for the near term reflects growing selling pressure and weakening momentum, especially on the 1-hour and 4-hour charts. The presence of an ascending wedge on the daily chart, coupled with a double top breakout and spikes in bearish volume, increases the likelihood of a deeper correction to support levels of $94,000–$90,000 if the downward movement accelerates.