1. Daily Analysis — Top formation gradually emerging, bears waiting for the right time to act.
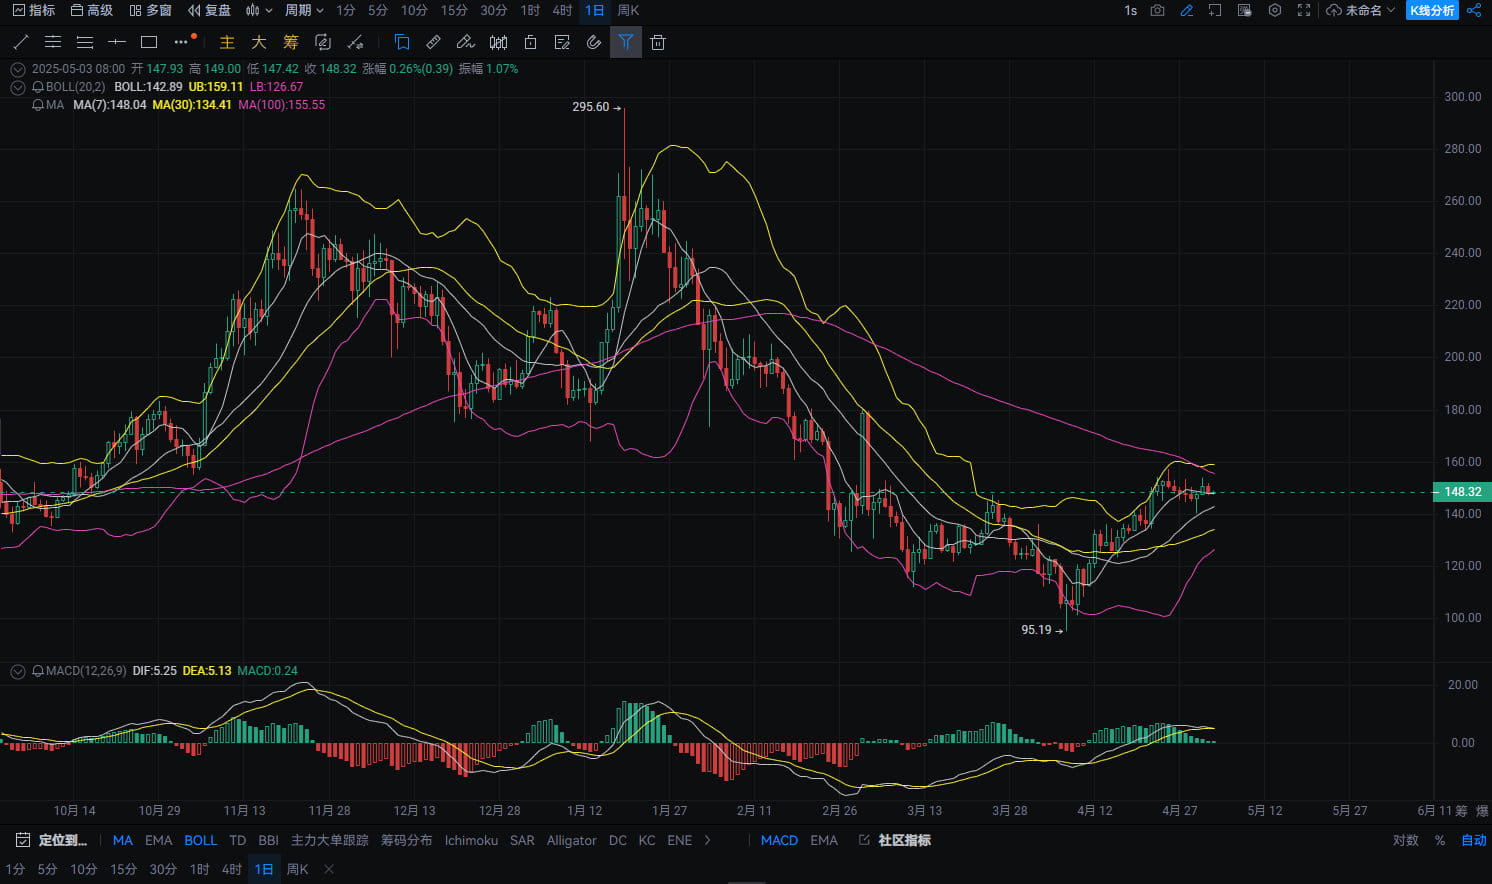
From the daily chart, SOL has maintained a strong upward trend since early April, reaching a high of 157.24. However, there have been significant signs of a pullback recently. The bearish candle from yesterday engulfed the bullish candle from the previous day, showing signs of a top gradually forming. The Bollinger Bands have started to contract, and the price is currently around the middle band (approximately 148.34).
The red bar momentum of the MACD indicator has begun to decline, with the fast and slow lines about to form a death cross, and green momentum bars appearing without showing signs of a rebound. If the daily chart continues to operate below the middle band, bears may further dominate.
Technical Conclusion: The daily chart shows top pressure, and bearish momentum may continue to amplify.
2. Four-hour Analysis — Death cross established, price difficult to break through in the short term.
On the four-hour chart, the price has retreated from the high point on the 3rd, and the moving average system shows a clear bearish arrangement, with MA7 forming a death cross with MA30, and the price falling below MA30 (approximately 148.5). In the short term, the Bollinger Bands also began to close downward, with the price nearing the lower Bollinger Band. If it continues to lose support, it may further break below the lower band and enter a downward channel.
The death cross of the MACD has been established, with green bars continuing to expand, indicating that bearish strength is increasing. If it cannot break through the resistance above 150, the price may accelerate downward.

Technical Conclusion: The four-hour chart is bearish in structure, indicating significant bearish pressure in the short term.
3. Hourly Analysis — Slight rebound under pressure, bears again in control.
On the hourly chart, SOL attempted to rebound to around 148.9 but failed to break through the previous high of 149.5, indicating a lack of strength in the rebound. The current price is maintained between the middle and lower Bollinger Bands, and if it breaks below the support level of 147.5 in the short term, it may accelerate downward.
The MACD shows that the short-term is still in a death cross state, and the green bars have a trend of expansion. Considering that market sentiment has not recovered, the bullish rebound has not received effective support, so there is still downward pressure in the short term.

Technical Conclusion: The hourly chart shows a continuation of the bearish trend, with increased risk of downward movement in the short term.
4. Operational Strategy Suggestion (Focus on Bearish)
📍 Current opening range: Around 148
🎯 First Target: 146.5
🎯 Second Target: 145
❗ Target: 150
📌 Strategy Logic: SOL has formed a top structure, clearly under short-term pressure, with bears in control. It is recommended to set up short positions near the current price, and to stop loss if it breaks above 150.
5. Summary
The technical aspect of SOL has shown top pressure, especially under the bearish resonance of the daily and four-hour charts, which may lead to a significant pullback in the short term. The current price is at a key support level around 148, and if it fails to hold, it may accelerate downward. In terms of operations, focus on short positions, strictly set take profit and stop loss to guard against risks from rebounds.
#sol #STO #om #非农就业数据来袭 #币安HODLer空投STO $SOL $PUNDIX $BROCCOLI714


