K-lines are the most basic symbols of market movement; they carry the trajectory of money flow and record the process of gains and losses.
They are given life by people, showcasing their hopes, suspicions, fantasies, greed, and fear, and encompass rich natural laws.
Understanding K-lines allows you to comprehend human nature in trading.
01. You better believe it
A falling leaf is a sign of autumn. This is the way of thinking brought to us by K-line charts. It significantly reminds us that no matter how large the market movement is, it develops from minute clues. Whoever can accurately capture these clues first can avoid greater losses and gain maximum profits.
Every K-line chart is trying to gesture to you, telling you about the changes happening in the market. You must calm down and carefully identify to understand the rhythm amid the noisy market.
The development and failure of everything seem chaotic, but in essence, they are governed by inherent laws, and K-line charts are no exception.
Here, apart from people, there is nothing else. You need to analyze the guesses, intentions, understanding of supply and demand, and relative strengths of buyers and sellers through this chart.
A chess game is a lifetime; a chart is too. This chart embodies the joys, angers, sorrows, and pleasures of countless global traders, whose hard-earned wealth is constantly being redistributed here.
Like magical banknotes, the K-line chart, which is of real concern to hundreds of millions around the world, also genuinely influences people's trading and gains and losses.
You have to believe it because hundreds of millions are reading it, using it, and trying to manipulate it. The movement of K-lines speaks louder than words, predictions, and appearances.
However, when facing the same chart, Easterners prefer to grasp it with philosophical methods, while Westerners prefer statistical results. Yet, no statistical tool, no matter how scientific, can accurately capture the psychological changes in the speculative world. If one overly relies on computer analysis systems, anyone can trade based on buy/sell signals, and speculation will devolve into a video game, quickly devaluing the trader's mind.
02. Each person has their own method
K-line charts are not a science but a practice of behavioral art and investment philosophy. They are essentially a concentrated reflection of the market's collective psychological factors.
You can grasp its nature, but cannot control its degree. It leaves many subjective judgments for everyone, leading those who attempt to quantify it into confusion.
This is a world that statistics cannot understand. Here, rationality is often the greatest enemy. There are no absolute certainties or unchanging things, only general experiential summaries.
Just as there are no perfect trades, there are no perfect shapes in K-line charts. When analyzing shapes, you should not be limited to the shapes themselves but rather delve into their intrinsic essence and understand the changing power dynamics between bulls and bears.
The analysis of K-line charts carries a strong subjective color, which leads to everyone, after completing the same course, being able to diagnose the market through K-line charts and implement it, but each person's methods and effectiveness are different.
This depends on an individual's character,
This depends on an individual's insight,
This depends on an individual's experience,
This depends on their market philosophical view,
This depends on their understanding of risk,
This depends on their considerations for returns,
This depends on the influence of their surrounding environment,
This depends on the characteristics of the market they are trading,
This depends on their capital scale, etc.
Western technical analysis emphasizes scientific rigor, while Eastern technical analysis emphasizes dialectical thinking. Combining the advantages of both, the best trading method is: focus on your losses and let profits run. Therefore, even if everyone has their own method, in the end, they all return to the same source.
03. The essence of natural law
There is the law of inertia in nature, which states that objects will move in the direction of the force applied, unless influenced by new forces.
The market is the same. Initial economic data, news, guesses, etc., lead to a trend, and K-line charts will develop along these forces; once internal and external factors change, prices will reverse until a new balance of forces arrives.
There is the law of acceleration in nature, which states that an object needs external force to rise but will accelerate downward due to its weight. The market is the same; upward movements will consume a large number of buy orders, leading to a surge in trading volume, while downward movements can be sharp declines without volume. This explains why short selling is easier than going long and reflects the inevitable law of bull markets being short and bear markets being long.
There is the law of reaction in nature, which states that forces are mutual. In the market, the prices of goods and stocks influence market psychology, causing fear or greed; conversely, market psychology also influences prices, pushing them up or down. There is no question of whether the chicken or the egg came first; the law of reaction always exists.
There is also Newton's fourth law, which states that increased movement reduces returns. The same applies to the market; frequent short-term trading will continuously deplete capital and reduce the total returns of traders.
There is also the law of conservation of energy, which states that any form of energy will transform into another form over time. The market is the same; the energy for going long and the energy for going short constantly transform, and phenomena of varying heights and lengths are also common.
There is also the law of yin and yang, which states: old yin gives birth to little yang, little yang transforms into old yang, old yang gives birth to little yin, little yin transforms into old yin, old yin gives birth to little yang; pure yin does not give birth, solitary yang does not grow, yin contains yang, yang contains yin, and the transformation of yin and yang continues endlessly.
The market is similar; bulls will eventually sell and become bears, and bears will eventually become bulls after regrouping their capital; the time of the bull's death is when the bear is born, and the time of the bear's slumber is when the bull awakens; there is a demand for local rebounds in a downward trend, and there are demands for temporary adjustments in a rising environment.
In K-line movements, there is no best shape, nor is there a worst shape. The same shape in different contexts or times will have different meanings and predictions. There is no absolute success here, nor is there definite failure.
When the prediction of a shape fails, it is often your opportunity to reverse your position; when the prediction succeeds, you may already have one foot in the door of losses.
Misfortune relies on good fortune, and good fortune hides in misfortune. When analyzing K-line charts, it is essential to assess the same information source from both optimistic and pessimistic perspectives. Many times, even when dressed in the same attire, the market's gestures can be different.
Thus, when faced with each K-line, we might often ask two questions: If the trend is indeed bullish, why are the bulls not...? If the trend is indeed bearish, why are the bears not...? In this way, the mystery will be revealed.
04. The embodiment of dialectics
Everything is relative; without relativity, there is no yin and yang, long and short, fast and slow, rising and falling, etc. Everything is in motion; there are no absolute isolates, only relative movement and methods to solve problems within that movement.
Everything is contradictory; there is me within the enemy and the enemy within me, making it hard to distinguish between the two. Only contradictions constitute true order; everything can be transformed; yin and yang can transform, energy can transform, and time and space can transform. If one rigidly adheres to one side, it is akin to carving a boat to seek a sword.
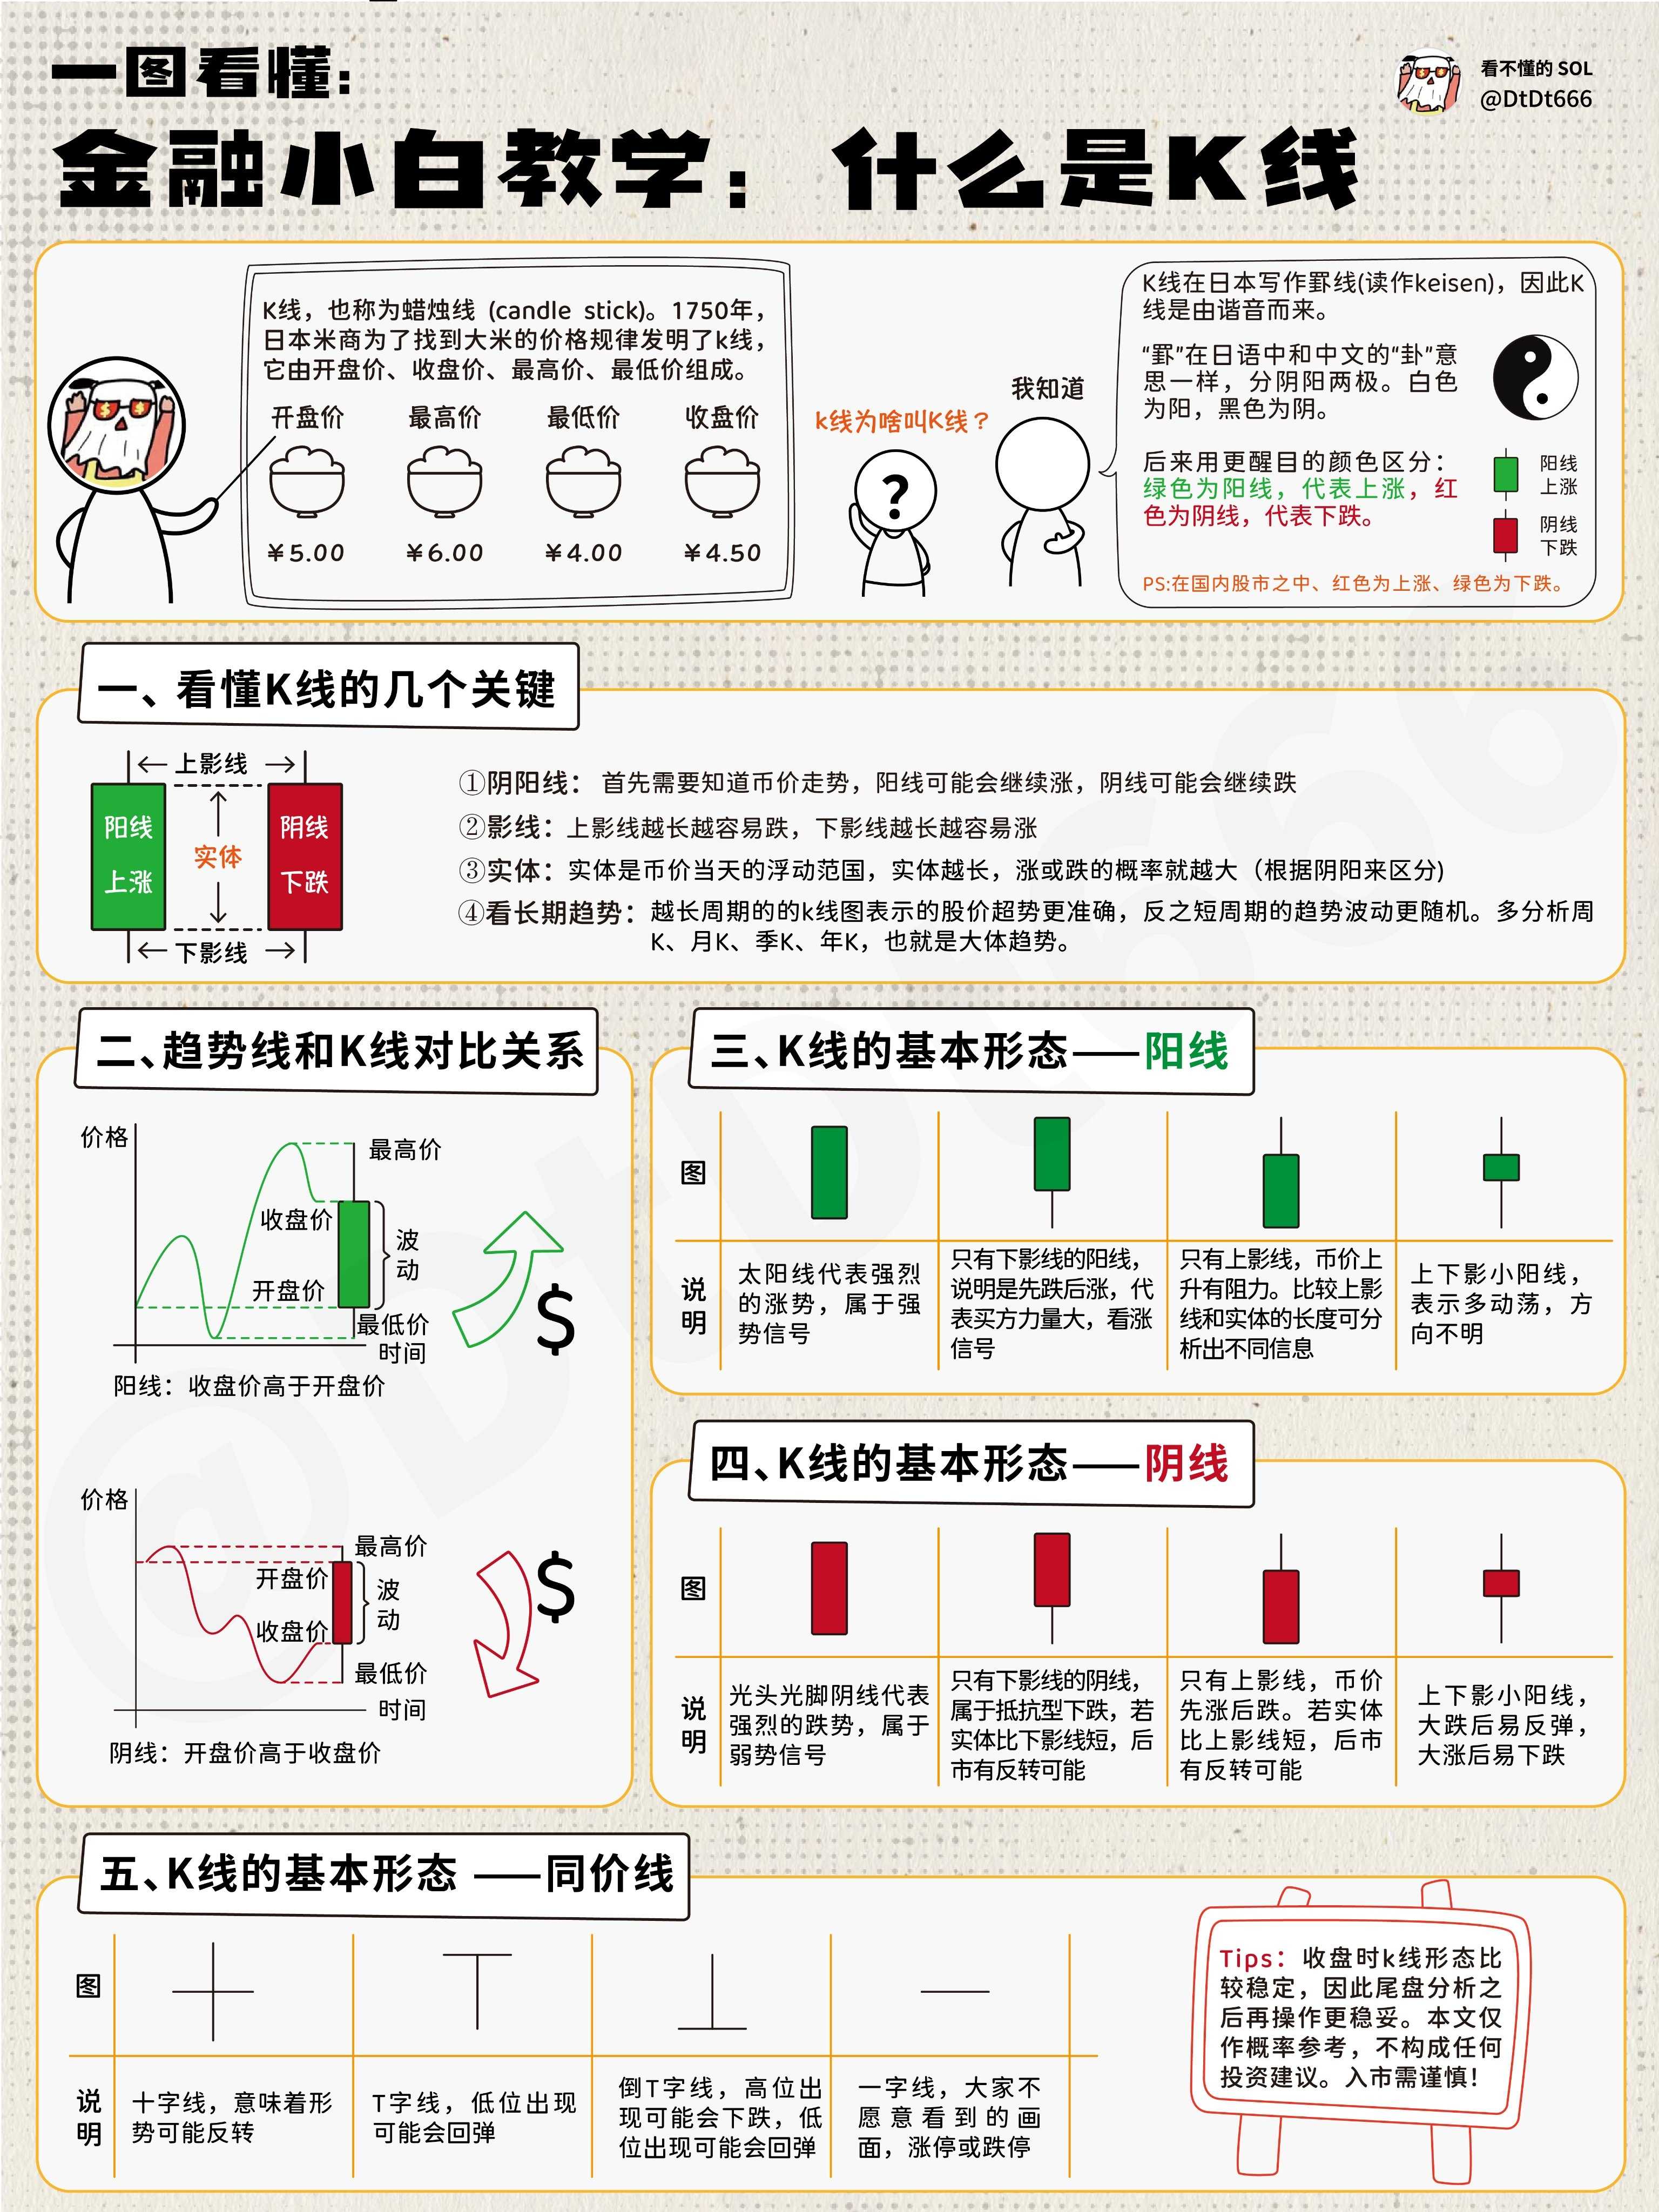
For K-lines, from a micro perspective, you need to grasp the meaning contained within them. For example: the longer the body of a bullish candlestick, the more favorable it is for rising; the longer the body of a bearish candlestick, the more favorable it is for falling; but after a series of strong upward movements, beware of a severe decline; after a series of strong downward movements, beware of a potential rise; if the shadow is very small relative to the body, it can be treated as negligible.
The longer the shadow pointing in one direction, the more unfavorable it is for the market price to move in that direction later; if both upper and lower shadows are long, it indicates fierce battles between bulls and bears, ultimately ending in a stalemate, making the future unpredictable; the appearance of a doji is often a transitional signal rather than a reversal signal, indicating that the market has temporarily lost its sense of direction. And so on.
From a macro perspective, it is necessary to understand how to grasp the operational laws of K-line charts as a whole. For example, monthly K-lines are more reliable than weekly K-lines, weekly K-lines are more reliable than daily K-lines, and daily K-lines are more reliable than hourly K-lines.
For two or more K-lines, the most important factor is their relative positions; different positions mean different price ranges. Next is their shapes, whether they have shadows or not, how long or short they are, etc.
Finally, their colors matter, whether they are bearish or bullish; also, the trend trajectory before the price shape forms is key to deciphering future trends. Rising and falling, fast and slow, big and small are all relative to past trends; only by comparing with the past can one know the future.
Tactically, one needs to grasp the essence of guerrilla warfare. That is: retreat when the enemy advances, disturb when the enemy is stationed, attack when the enemy is tired, pursue when the enemy retreats. In guerrilla warfare, one must operate with certainty; advance and retreat boldly, entice the enemy deep, concentrate forces, and break them one by one in mobile warfare.
06. Neither sad nor happy
For traders who analyze using K-line charts and enter the market based on that, three things must be understood:
First, the standard K-line patterns illustrated in books may never be seen by you, so you need to grasp the degree of recognition.
Second, what is technically feasible may not be realizable in actual price movements; for example, a price gap down may leave your stop-loss behind, rendering your stop-loss strategy ineffective.
Third, the market is something that self-repairs and self-mutates because the people participating in the market become wiser, thus the market becomes smarter as well. Methods that previously worked flawlessly may become ineffective.
The K-line chart itself has no good or bad distinction; it will not make you profit or incur losses. It is your recognition ability and operational rules that cause your capital to fluctuate. For those traders who have lost money, the fundamental reason lies in their incorrect analysis of the market or a lack of ability to translate correct analytical results into actual operations.
For instance, in a K-line chart, what price is most important? People often answer: the buying price. Because you are involved in this matter, your attention to this price is extremely high, and you will search everywhere for reasons for your losses when in the red or gather evidence to continue holding from the same pile of information.
But the wind remains wind, and the fence remains a fence. Excessive concern and enthusiasm expose your desires, greed, and fear, which is the reason you cannot convert correct analytical results into profits.
Success often results from trading according to a plan. The wealth of Buffett and Soros is not 'earned' but the product of their thoughts and strategies being correctly implemented. Their lives are a continuous process of validating their thoughts and strategies. Therefore, you must transform your investment behavior into a study behavior and trade strictly according to the correct plan, which will change the mentality of anxiety and the situation of being taken advantage of.
06. Price/Volume/Time
There is a saying among Japanese traders: The first hour of trading guides the trading day. It is evident that the opening trend often lays the foundation for the day's trading.
The opening price is the result of people's deep contemplation overnight, a process of confirming or correcting yesterday's price, and the beginning of today's new price establishment or tentative offense.
Regarding closing prices, since most methods of Western technical analysis, including how much margin to add, are based on closing prices, both bulls and bears often engage in fierce attacks near closing time, clearly displaying their positions.
At the same time, those automated trading systems often judge whether certain patterns are established based on prices before closing and conduct large amounts of trading accordingly.
Here, price is a commodity, and the entire market trading is a process of discovering the 'value' of prices. When someone feels it is 'cheap,' they will buy in large quantities, causing the price to rise; when people feel it is not worth that price, they will stop buying, causing the price to fall.
People’s value judgments are influenced by market emotions and fluctuate around the 'value' of prices, artificially raising or lowering that 'value.'
If prices can tell us what has happened in the market, then trading volume can tell us how it has happened; it represents market sentiment and the relationship between supply and demand.
Any price and trading volume are relative to a specific time; within a defined time frame, market trading psychology will not be the same. Trading volume is the result of the consumption of bullish and bearish forces, reflecting the intensity of the struggle between bulls and bears.
Time and price also have a dialectical relationship. For example, the longer the consolidation at a price level, the more likely it is to shift to a higher or lower price; when price movements are more intense, the future period of silence may also be longer.
The longer the movement takes, the greater the uncertainty, often leading to the inevitable failing to happen while the impossible becomes a reality. The market uses an internal mechanism to constrain price, time, and trading volume.
07. Reversals are crucial
As a trader, you must pay attention to all kinds of reversal signals you encounter, even if they are false. Missing a genuine dangerous signal can sometimes lead to losses that we cannot bear. Our entry and exit occur only when reversal signals arrive.
You can wait calmly for the subsequent confirmation patterns or trade eagerly, but the key is to patiently wait for reversal signals to appear. Otherwise, if the market consolidates after your entry, you will lose control over your funds and suffer internally.
Most of the time, reversal trends are accompanied by star patterns or candlesticks with long shadows, traces of which have been counterattacked by bears, indicating that success is not far away from a failure—yet these are often ignored.
In essence, this indicates that people are often only interested in success and indifferent to failure, but such views from the masses should not appear in professional traders.
Although reversal signals indicate a change in situation, they do not tell people that the trend will immediately reverse; it may consolidate sideways or adjust in the opposite direction. Therefore, selling all assets immediately after a reversal signal is not a wise move.
Reversal signals are often breakthrough signals as well. Market leaders often use 'breakthroughs' to test market reactions at support and resistance zones and then unfold the next steps based on these tests; thus, these testing breakthroughs often carry significant meaning. However, some leaders may also create false breakouts to undermine traders' judgment or attract followers as sacrifices.
But whether it is a testing breakthrough or a false breakout, they often reveal their true nature at closing time or on the next trading day. It's just that after a testing breakthrough, the main force may continue to test until a true breakthrough occurs, while a false breakout will quickly reveal its reverse intent after enticing success or failure.
08. Formulate a trading plan
Although the trading market is vast and unfathomable, a K-line chart can encapsulate it; although K-line charts are endlessly variable, they only have three trends after closing: rising, sideways, falling.
Facing the three trends of rising, sideways, and falling that may appear after you enter the market, the only thing you can do is prepare a complete offensive and defensive strategy.
Whether you are trading short-term or medium-term, you should consider a reward/risk ratio before entering. You should only enter when you feel that the profit space is at least three times larger than the loss space, meaning that when your profit target is three times your expected loss, it is worth entering. If such a price trend does not emerge, do not enter lightly.
The timing of entry is crucial, but you don’t know if it’s a trap. If you are a medium-term trader, you can enter after a reversal shape appears and is validated, such as waiting to see a clear continuation breakthrough the next day before entering.
If you are a conservative short-term trader, you can enter after a reversal shape appears and is partially confirmed, such as two hours after a breakout signal is generated; generally, the situation is clearer by then.
If you are an aggressive short-term trader, you can enter promptly after a key point is broken, but you must prevent the possibility of a failed attempt to break, which could suddenly reverse.
At the same time you enter, quickly consider where your first/second profit targets are, and where your stop-loss should be set; once you buy, if the price continues to rise, when it reaches a certain stage, you need to decide whether to increase your position and by how much, while also adjusting your stop-loss.
When it rises to a reversal shape, you should consider whether to sell a portion or all of it; when reaching your profit target, you should consider whether to close your position or adjust your profit target and stop-loss.
If the price stays flat after buying, you should consider whether your stop-loss is set reasonably and whether it is worth holding onto this asset; if the price drops after buying, you should consider whether to sell some at the original stop-loss point or sell all—thus, no matter how the market changes, everything is under control.
09. Always follow the trend / Stop loss
In the face of the magnificent movement of funds and the mysterious changes in prices, no one dares to guarantee their expectations. The most important survival tools in the speculative market are following the trend and stopping losses, which are the only ways to deal with uncertainty. The former is proactive adaptation, and the latter is proactive defense.
In the trading market, if you cannot actively adapt to the environment, the market will immediately swallow you. To learn to actively adapt to the environment, you must learn to trade according to a plan, not according to expectations.
Without expectations, one will not enter the market, so everyone will have expectations, but not every expectation will be realized. Successful traders know to go with the trend and recognize mistakes in time.
Making mistakes is inevitable, but the truly fatal mistake is to persist in being wrong. If you impose your expectations on the market, the result is often no different from a mantis trying to stop a car.
You must understand that the market does not care about your thoughts and positions, nor does it care whether you comply with its trends. It will only flatten all traders standing in the way of its trend.
So, if you have a bullish expectation, you should enter when the upward trend is confirmed; if you have a bearish expectation, you should sell when the downward trend is confirmed; one more rule: only accumulate in bear markets and sell in bull markets.
Whether in the cryptocurrency market or in U.S. stocks, trading is like taking chestnuts from the fire. All profits come from strictly guarding against losses. Adhering to stop-loss rules is to preserve your capital, giving you the opportunity for a comeback. Following the trend and stopping losses are trading principles that every trader must possess.
Let's encourage each other!
