$ETH Let's conduct an advanced technical analysis of the ETH/USDT chart on Binance with a time frame of 1 day (1D), using professional tools and concepts to identify patterns, key levels, and possible trading scenarios.
---
### 1. General Context
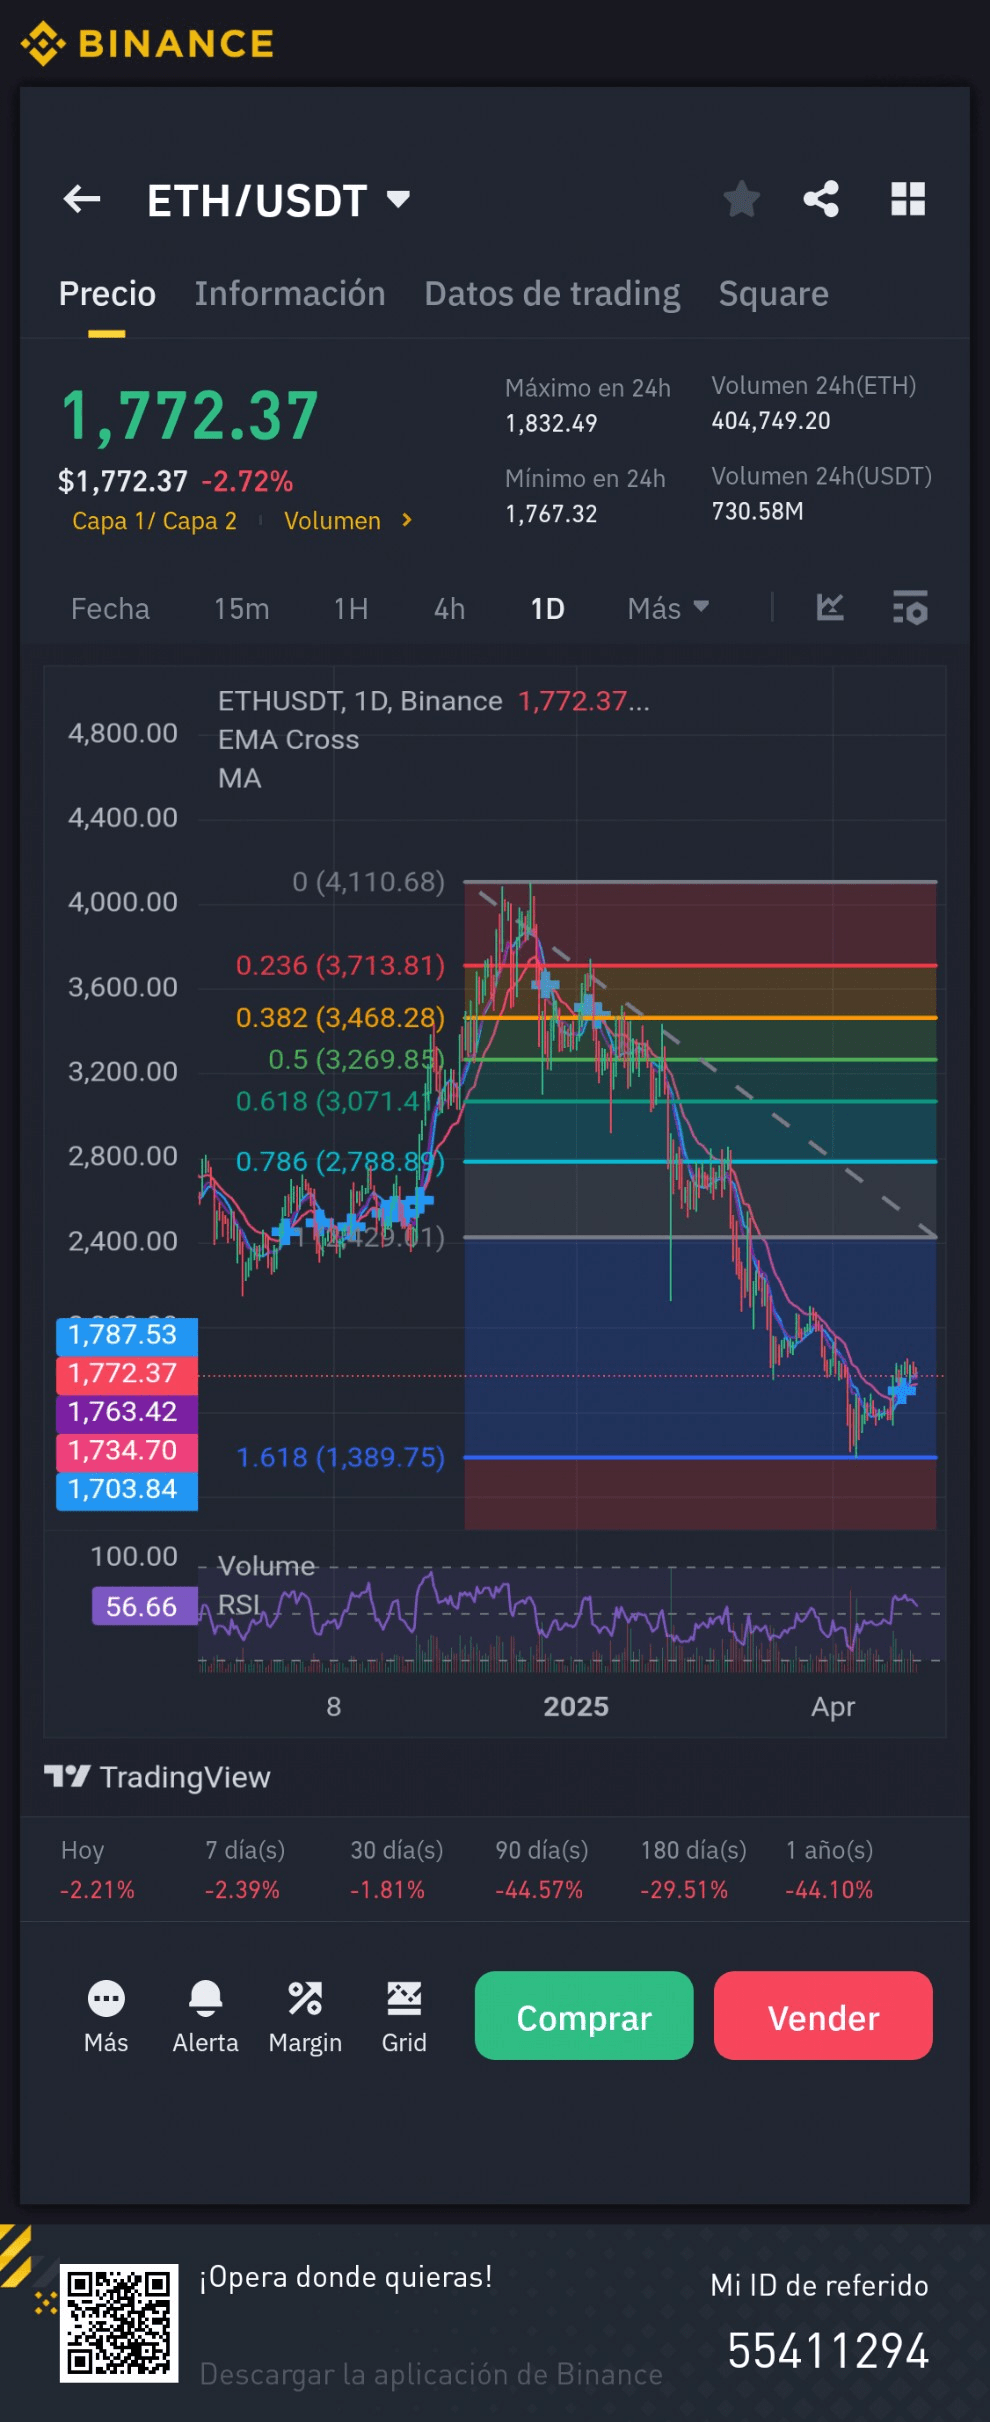
- Current price: 1,772.37 USDT, with a drop of 2.72% in the last 24 hours.
- Recent volatility: High of 1,832.49 and low of 1,767.32 in 24 hours, with a volume of 404,764.920 ETH (equivalent to 730.58M USDT), indicating significant activity.
- Historical performance: The chart shows a bearish trend from levels above 4,000 USDT (around November 2024), with a cumulative correction of 44.57% in 90 days and 29.51% in 180 days.
---
### 2. Trend Analysis and Market Structure
- Main trend: Long-term bearish. The price has been forming lower highs and lower lows since the peak of 4,110.68, confirming a bearish structure.
- Current correction: From the recent high of 2,788.89 (likely in March 2025), the price has dropped 36.5% to the current level. This indicates a continuation of the bearish pressure, although it may be approaching a turning point.
- Ichimoku Clouds (implicit in the shaded areas): The colored areas in the chart appear to represent historical support and resistance levels or Ichimoku clouds. The price is below the cloud (probably red or bearish), reinforcing the bearish trend.
---
### 3. Technical Indicators
#### a. Moving Averages (EMA Cross and MA)
- The chart shows an EMA Cross (probably EMA 20 and EMA 50) and an MA (possibly MA 200).
- Bearish cross: The moving averages are above the price, and the previous bearish cross (faster EMA below the slower one) marked the start of the decline from 2,788.89.
- MA 200 (approximate): If the visible MA is the MA 200, it is around 2,788.89, acting as strong resistance. The price needs to exceed this MA to signal a trend change.
#### b. RSI (Relative Strength Index)
- Current RSI: 56.65, in neutral zone (between 30 and 70).
- Interpretation: The RSI is neither overbought nor oversold, indicating that there is no extreme momentum in either direction. However, it is close to the 50 level, a key point that could act as support (if it falls) or resistance (if it rises). An RSI below 50 would confirm a stronger bearish momentum.
#### c. Volume
- Current volume: 56.65 (relative scale in the chart).
- Analysis: Volume has decreased compared to previous peaks (such as the volume of 730.58M USDT in 24h). This suggests that selling pressure may be decreasing, which could be a signal of seller exhaustion.
- Pattern: Volume spikes in the past (such as at 1,618 and 2,788) coincide with significant price movements, indicating that an increase in volume could precede a directional move.
---
### 4. Support and Resistance Levels
- Key supports:
- 1,772.37 - 1,787.53: Current support zone, reinforced by recent lows.
- 1,618.00: Psychological level and strong historical support (visible in the chart). If the price falls below 1,772, this will be the next target.
- 1,389.75: Deeper support, marked as the recent historical low.
- Key resistances:
- 1,878.89: Immediate resistance (recent high before the drop).
- 2,071.41: Intermediate level, where the price previously consolidated.
- 2,788.89: Strong resistance (coincides with MA 200 and a relative high). This level will be crucial for a trend change.
---
### 5. Price Patterns
- Descending channel: The price appears to be within a long-term descending channel, with the upper channel at 2,788.89 and the lower part near 1,618.00. The current drop is testing the lower part of the channel.
- Divergence in RSI: Although not clear in the chart, the RSI has not fallen as much as the price, which could indicate a hidden bullish divergence. This suggests that bearish pressure may be weakening.
- Possible double bottom: If the price remains above 1,618 and bounces from 1,772, it could be forming a double bottom pattern, which would be a bullish signal.
---
### 6. Ichimoku Analysis (implicit in the shaded areas)
- Cloud: The price is below the cloud, indicating a bearish trend.
- Tenkan and Kijun Lines: If the visible lines are Tenkan (fast) and Kijun (slow), the previous bearish cross confirms the trend. A bullish cross (Tenkan above Kijun) would be a reversal signal.
- Chikou Span: If the Chikou Span (lagging line) is below the price and the cloud, it reinforces the bearish outlook.
---
### 7. Trading Scenarios
#### Bearish Scenario
- Condition: The price breaks below 1,772.37 with an increase in volume.
- Target: 1,618.00, and if this level fails, 1,389.75.
- Confirmation: RSI falls below 50, and the moving averages continue to act as resistance.
- Stop Loss: Above 1,878.89 (immediate resistance).
#### Bullish Scenario
- Condition: The price remains above 1,772 and breaks 1,878.89 with increasing volume.
- Target: 2,071.41 as the first target, and 2,788.89 as a long-term target.
- Confirmation: RSI rises above 60, and the price crosses above the moving averages.
- Stop Loss: Below 1,772.37 (current support).
---
### 8. Risk Management
- Risk/Reward Ratio: For a bullish entry at 1,772 with a stop loss at 1,750 and a target at 2,071, the risk/reward ratio is approximately 1:13, which is favorable.
- Position: Given the risk of a bearish breakout, a conservative position is recommended (0.5-1% of capital per trade).
- Volatility: Recent volatility (range of 1,767 to 1,832 in 24h) suggests daily movements of 3-5%, requiring a tight stop loss.
---
### 9. Conclusion and Recommendation
- Current outlook: The market is in a bearish phase, but there are signs of a possible technical bounce. The support at 1,772 is key, and the neutral RSI along with declining volume suggest that selling pressure may be waning.
- Strategy:
- Short term: Wait for a bounce confirmation (break above 1,878.89) for a bullish entry targeting 2,071.41.
- Medium term: If the price breaks below 1,772, look for a bearish entry targeting 1,618.
- Warning: Ethereum $ETH is a volatile asset, and the sentiment of the crypto market can be influenced by macroeconomic factors (such as interest rates or regulation). Monitor news and volume to confirm any movement.
Would you like me to analyze another aspect or look for additional information about the ETH market?