Below is the technical analysis of XRP/USDT based on the 4 timeframes you provided (5m, 1h, 1D) and the trading strategy for the next 24 hours:
1. Multi-timeframe analysis
1-day frame (1D)
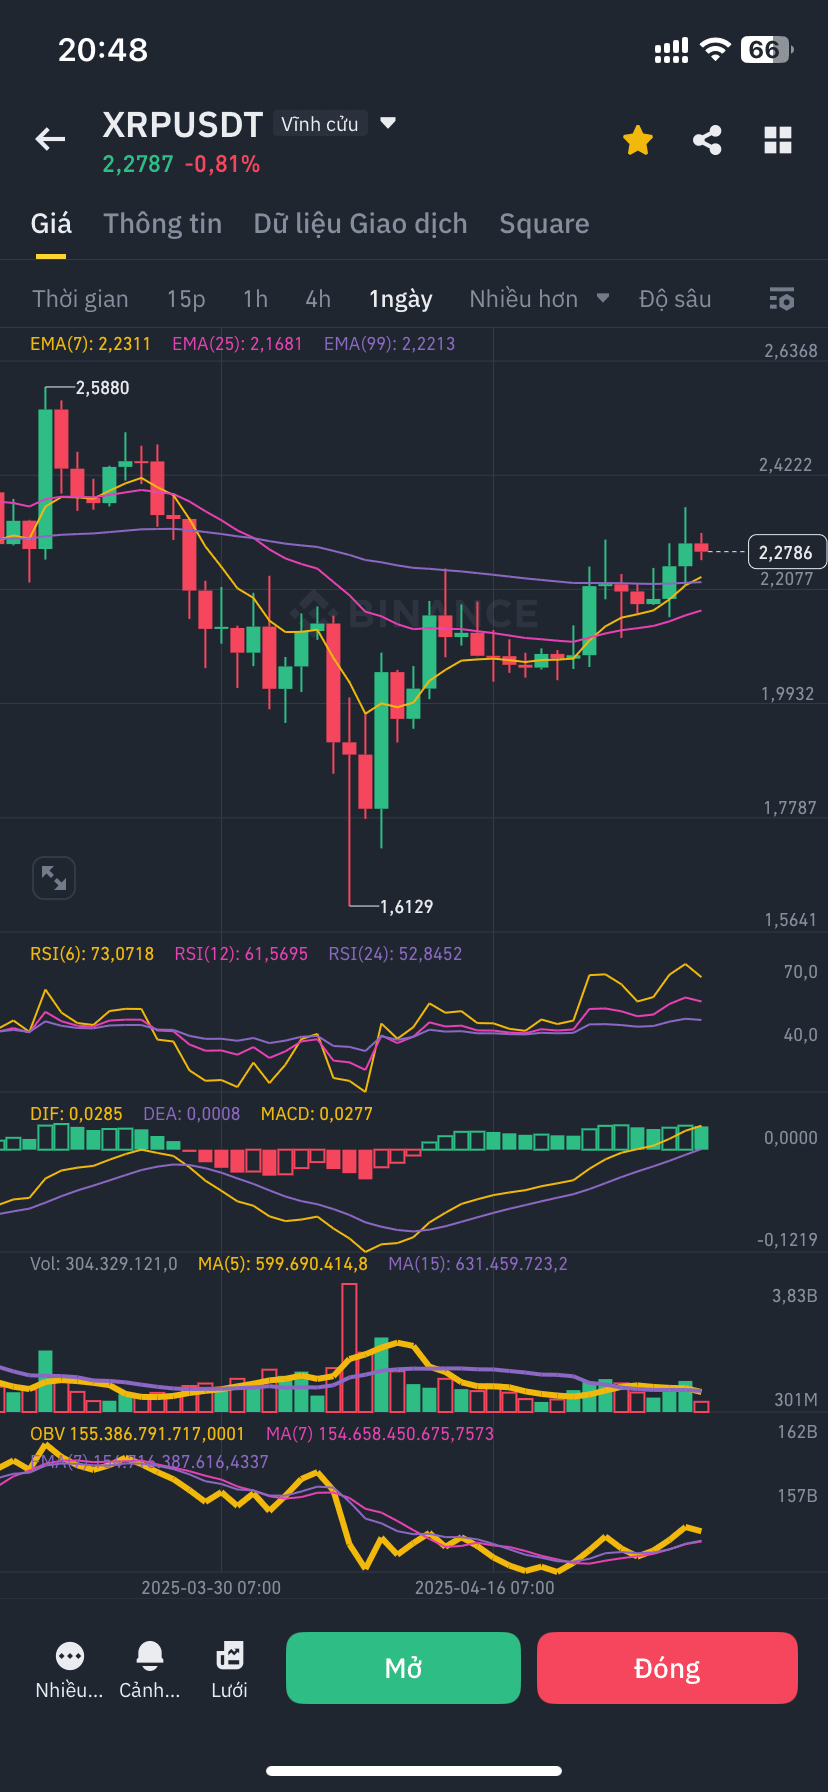
• Overall trend: Price is above EMA7 (2.2311) and EMA25 (2.1681), indicating that short-term momentum remains strong.
• MACD: Still above the signal line and maintaining a positive distance => Positive.
• RSI(6): 73 => Overbought, may have slight correction.
• OBV: Increasing again => Money flow is returning to the market.
=> The mid-term bullish signal is still valid.
1-hour frame (1H)

• The price has just dropped below EMA7 (2.2819) and EMA25 (2.2825), currently testing the support area of EMA99 (2.2445).
• MACD: Negative crossover, histogram below 0 => Correction signal.
• RSI(6): 45.6 => Not oversold yet, but selling pressure is dominant.
=> Currently undergoing a short-term correction.
15-minute frame
• After a sharp drop to the 2.262x area, the price bounced back but hit resistance at EMA99 and was rejected.
• MACD: Negative and RSI neutral => Weak increase.
• Volume: There is buying pressure but not convincing enough.
=> The possibility of sideways movement or retesting the short-term low.
5-minute frame

• RSI(6): 58.3 => Short-term increase.
• MACD: Just had a slight positive crossover, histogram increasing => A technical rebound may still occur.
• The price is stuck between EMA25 and EMA99 => May still be hesitant.
=> Probability of a bounce back to the 2.29 – 2.30 area if not strongly sold again.
2. Short-term Future strategy (24h)
Main scenario (priority):
Set up a long when the price tests the strong support area of 2.25–2.26
• Entry: $2.260 – $2.270
• TP: $2.300 – $2.320
• SL: $2.245
• R:R ratio: ~2.0
• Reason: This is the nearest solid bottom, coinciding with the EMA99 support at the 1H frame. The MACD on the 1D frame is still positive.
Alternative scenario:
Set up a short when the price cannot surpass the strong resistance area of $2.30 – $2.32.
• Entry: $2.300 – $2.310
• TP: $2.270 – $2.260
• SL: $2.325
• R:R: ~1.5
• Reason: Dynamic resistance of EMA99 and EMA on the 1D frame, combined with an RSI that is overbought and adjusting.
3. Alerts & Monitoring
• If the price breaks $2.32, the upward trend continues clearly => Can consider buying the breakout.
• If the price breaks below $2.245, the likelihood of a strong reversal to the $2.21 region is very high.
• Volume is recovering, need to closely monitor the money flow in today's US session (29/04).