In trading, K-lines contain all the information in the market.
In a series of K-line trends, there are fast rises, gradual movements, and volatile trends. These seemingly random movements actually contain changes in market sentiment and the main force's direction. Therefore, by identifying the shapes of K-line trends, we can track trend-following trades and reversal markets.
This is the angle theory in K-line trading.
The angle represents the continuity of a series of K-line trends and the strength of the trend.
For example, in a strong rise, there is a very classic pattern called a bullish arrangement, where the moving averages are evenly distributed from short-term to long-term from top to bottom without any crossings.
This pattern often indicates that it has entered the upward stage but is also experiencing accelerated upward movement, with a very large angle. This indicates that bullish sentiment is high, and more buying power is entering the market during the rise.

We generally believe that during the upward push by buyers, as the bulls exhaust their chips, the upward momentum will also exhaust. However, angle theory suggests that a gradual rising process indicates that the main force's pushing power is not strong. But as the market reaches a consensus, the main force and other funds work together, the market will accelerate upward.
Today, we will understand the secrets of industry trends and reversals from the perspective of K-line trends.
1. Three types of trend angles
In angle theory, rising markets are divided into strong rising, moderate rising, and weak rising angles.
1. The strong rising angle refers to an upward trend with a very steep slope.
Generally speaking, when the market breaks out, it often retests to confirm support. However, in strong markets, because market sentiment unanimously favors bullish views, bulls will not provide any opportunities for buying on pullbacks, leading to this strong upward angle.
The method of identification is that when you see a relatively stable market, and multiple K-lines rapidly attack, forming a steep trend, it indicates the emergence of a main upward wave. At this time, there will often be an increase in volume, and the MACD's DEA and DIF will begin to diverge significantly from the zero axis.
Note that this is not necessarily a divergence signal but indicates that short-term sentiment is extremely strong. During this process, the two lines will repeatedly converge. Only when we see a high-position death cross in the MACD and a significant increase in green bars is it a divergence turning point.

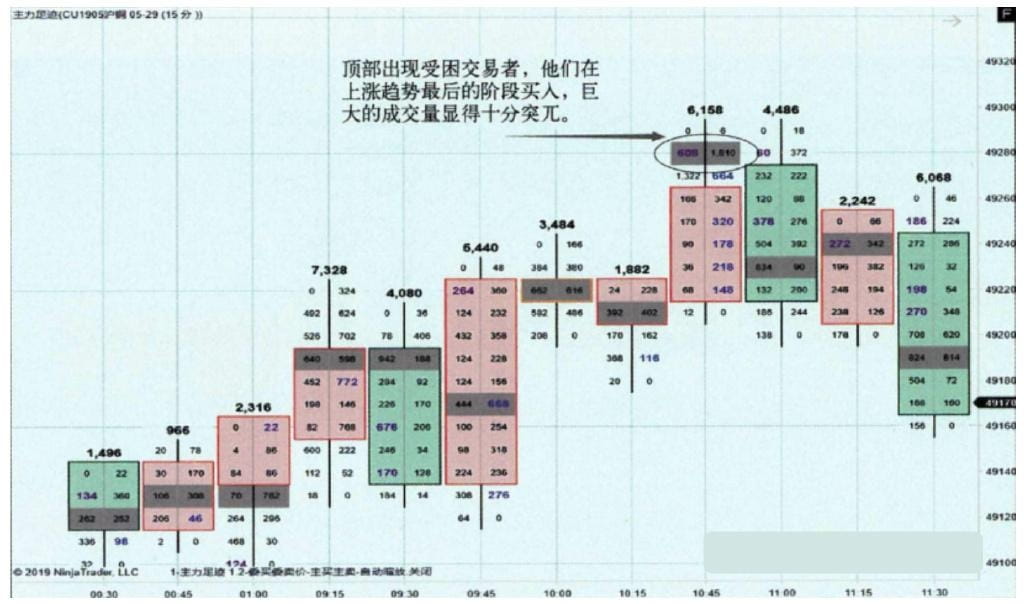
Here we can also combine trading volume to identify top signals.
Generally speaking, when the maximum trading volume appears at the top of a K-line, it indicates fierce competition between bulls and bears, and the resistance at this position is often very strong.
In the order flow tool, the price level with the highest trading volume for each K-line will be counted in real-time, referred to as POC. When POC appears at the top, it indicates a high likelihood of a short-term peak at this position.
Additionally, when we find in the order flow tool that if a K-line at a relatively high position has only long positions at its top and no short positions, it is usually a signal of a peak. This is because our order execution mechanism pairs one short with one long; when there are no short positions, it indicates that the bears believe that prices cannot continue to rise, so they will not choose to go short at higher positions.
By combining these signal indicators, we can better identify the continuity of the trend.
2. Moderate angle, which is a 45° angle.
The moderate angle indicates that one side has not formed an absolute advantage over the other, and during this process, both sides will repeatedly test each other. Therefore, it often presents a volatile upward or downward trend, very similar to the channel lines we commonly see.
This is a secondary upward pattern, with the only issue being that this process is always making directional choices and could break and reverse at any time. Therefore, in a moderate rise, we generally enter near the lower boundary of the channel line and set a stop loss at the previous low.

3. The weak rising angle refers to a gradually rising angle.
This type of rise usually indicates that there is no buying power to drive it, and the trading volume is synchronously shrinking, which is a very easy signal for a trend change, and is not a good entry time.
However, conversely, when this pattern appears, it is actually the timing for us to go short. Once it breaks down, the force is often very strong. We can choose to enter near the previous low.

2. Angle combinations
In actual trading, the three types of rising angles often interchange, so there are acceleration of rising angles, deceleration of rising angles, and conversion of rising angles.
1. Acceleration angle of rising
This refers to the market moving from a gradual rise to a strong rise. The bullish arrangement we mentioned before is of this type.

Although the weak angle is usually not recommended for trading, because in most cases, weak rises cannot break through previous resistance levels. But if you see a sudden surge that breaks through previous resistance and quickly increases volume, it is an effective breakout signal, and we can consider entering near the resistance line.
It is worth mentioning that a significant feature of the breakthrough price level is the continuous increase in long positions. Especially in weak angles, if the market energy is not strong, to drive the market higher, the buying volume must be increased.
In the order flow tool, the ratio of buy orders to sell orders for each K-line is counted in real-time. If a certain price level has a buy/sell ratio >3 or sell/buy ratio >3, it is considered imbalanced. The former indicates a buying imbalance, implying strong market bullish sentiment; when buying imbalances occur three times in a row, it forms an imbalance accumulation, indicating that buyers are increasing their volume to attack.
The single flow tool will mark the accumulated positions to form resistance and support zones. When we notice these accumulations near the breakthrough price level, we can predict the effectiveness of the breakout.

2. Deceleration angle of rising
It is the opposite of rising acceleration, indicating that after a rapid rise, market momentum begins to weaken, leading to a deceleration in rising. However, this does not mean that there are no trading opportunities during rising deceleration.
Unlike the weak rising angle, the deceleration of rising only means that the speed of rise has slowed down and has entered a gradual rising phase; overall, it is still in an upward trend.
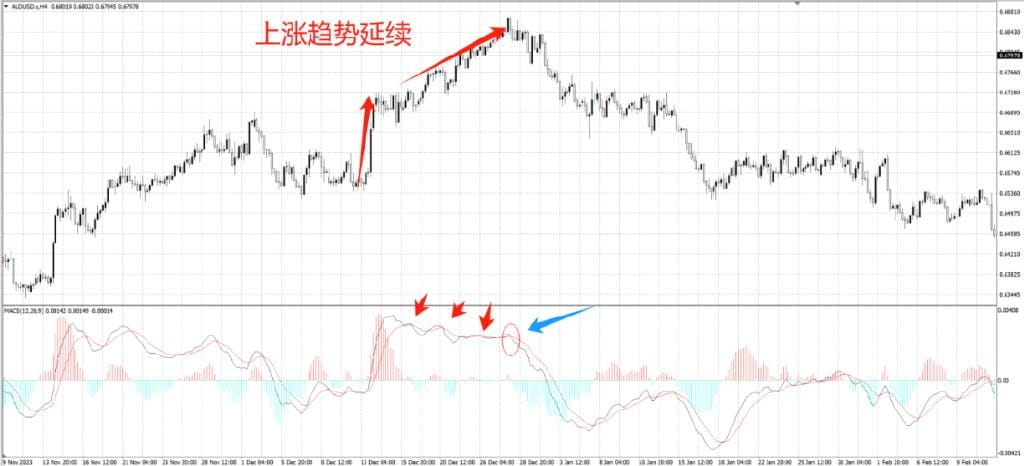
Due to the previous rapid rise, there is not much pressure above, so the upward momentum will continue for a while, and it can be combined with MACD to identify the momentum of the main upward wave.
Generally speaking, during this process, the MACD will repeatedly converge and diverge at high levels. As long as this process has not ended, it indicates the continuity of the trend. However, once a death cross occurs at a high position and the previous divergence pressure is released, the market will directly enter a downward trend.
3. Angle conversion
In addition to the acceleration angle of rising and the deceleration angle of rising, there is also a conversion of the rising angle.
It is generally composed of three or more angles, which can be strong + weak + strong.

It can also be weak + strong + weak.

However, it should be noted that the conversion of patterns is not necessarily continuous. Especially after two rounds of rising, there will always be people selling a portion of their chips at high positions, which will inevitably lead to a pullback in the market.
However, if the pullback is very limited, and during this process, it is a shrinking decline, it indicates that there are not many follow-up chips in the market. Once volume resumes, the upward trend will continue.

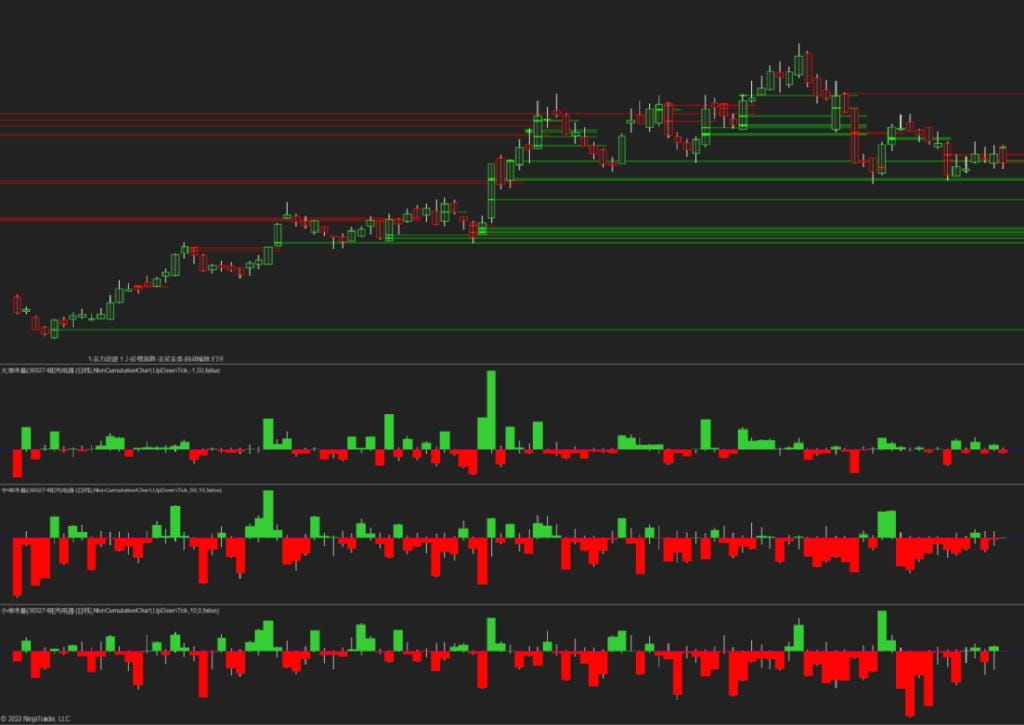
These positions of shrinking declines can also be tracked through net position numbers. Net position means the number of buy orders minus sell orders, so net positions reflect the current market sentiment.
When there is a shrinking decline, the net position at these locations is very small, indicating that neither bulls nor bears are very interested in entering, which suggests a high possibility of continued movement in the market.
The order flow tool will count the net position numbers in real time and record it as Delta. It is worth mentioning that the order data in the order flow tool is real-time, so the Delta data is also real-time.
When Delta is a bullish line with a long lower shadow, it indicates that the bears pressuring the market face resistance and are unable to push prices down, resulting in a situation where they have to sell short and buy long, thus forming this K-line pattern. This can help us more clearly confirm the bottom and top.
3. Reverse angle
What we discussed earlier is the angle under the continuation of the trend.
However, when this trend comes to a sudden halt, the market will move in the opposite direction, and the angle at that time is the reverse angle.
In a rising market, when a top signal appears, the subsequent reversal speed will determine the strength of the trend. It also includes three types: strong reverse angle, moderate reverse angle, and weak reverse angle.
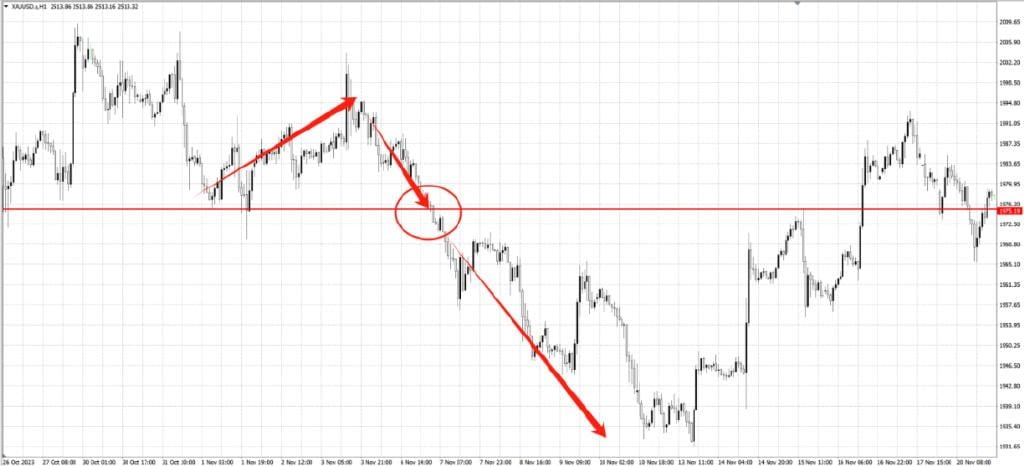
1. Strong reverse angle
The strong reverse angle refers to a sudden sharp drop during a weak rise. This indicates that the earlier pushing force was weak, and it is likely that the operators are creating signs of rising to facilitate selling at high positions.

Strong reversals can occur very quickly. If you haven't entered in time, you might consider entering when the support level is broken.
The moderate reverse angle means that both the upward and downward movements are almost symmetrical, indicating that the strength of the rise and fall between bulls and bears is the same. This means that the magnitude of the rise in the previous period may correspond to the magnitude of the fall in the later period, but there is not much room for larger rises or falls.

In the moderate reverse angle, both upward and downward movements are possible. We can refer to the breakout patterns at the tops and bottoms to confirm whether to follow.


Additionally, we can also leverage the previously mentioned imbalanced accumulation zones. If there is a selling imbalance accumulation at the support position, the likelihood of a breakout and drop is very high. Conversely, if there is a buying imbalance accumulation, it will form a resistance pattern.
3. Finally, the weak reverse angle
After a quick upward pull, a decline begins. Although it appears to be a top signal, a gradual angle indicates that the downward force is not very strong. The more gradual it is, the stronger the bulls' control ability, so it is likely to become a continuation signal.

It should be noted that the first pullback may be stronger. On one hand, there are indeed people clearing out forming short-term selling pressure; on the other hand, operators may wish to take this opportunity to absorb some chips, so they might conduct a false breakdown at this position, potentially slightly breaking the 61.8% level.
4. Original force zone and reversal zone
When the market runs at a certain angle, it will form various ranges.
If these range lengths are close and the angles are the same, they form a group of original force zones. Its principle is actually similar to market fractals, treating ranges of the same level as a group to judge the continuity of trends.
As shown in the figure, the four original force zones gradually elevate, demonstrating the continuity of the trend. However, after the fourth zone appears, it becomes difficult to maintain the trend, and it begins to reverse downwards, indicating that the trend has peaked.

An important point about the original force zone is that the lengths of time and space must have the same cycle; if this condition is not met, effective analysis cannot be made.
The range elevation not only conforms to the normal upward pattern in Dow theory, but also aligns very well with Wyckoff trading principles. It has been mentioned in (Wyckoff 2.0) that each trading range actually corresponds to high trading volume nodes.

Breakthroughs usually occur at low trading volume nodes. Because at high trading volume nodes, after one side determines victory, the losing side, due to exhausted chips, only needs a small amount of chips to push prices higher.

By combining the chip distribution in the order flow tool, we can identify the continuity of the original force zone by tracking the changes in trading volume nodes.
Additionally, when the trend represented by the original force zone comes to an end, there will usually be a turning signal, which is the turning range.
The turning range will significantly change the length of time and space. As shown in the figure below, the length and height have been swapped, forming a horizontal range, indicating that a direction needs to be chosen here.

In summary, through the shapes of K-line combinations, we can identify the strength of the trend and further predict the positions of tops and bottoms. By combining trading volume and MACD indicator divergence, we can more accurately predict market turning changes.
If you lack support from technical analysis and news, and just look at the decline ranking and popularity ranking to make trades! Then you will not be able to pay long-term attention to my screen commentary at 555, it's better to take profits.
#币安Alpha上新 #加密市场反弹 #Strategy增持比特币


