

While Solana (SOL) is currently hovering around $150, an ambitious price prediction has stirred the crypto community: this popular altcoin could potentially surge to $4,500, according to analyst Ali Charts. But despite the hype, market signals suggest that this scenario isn’t likely anytime soon.
📈 Bullish Pattern: The Cup and Handle Formation
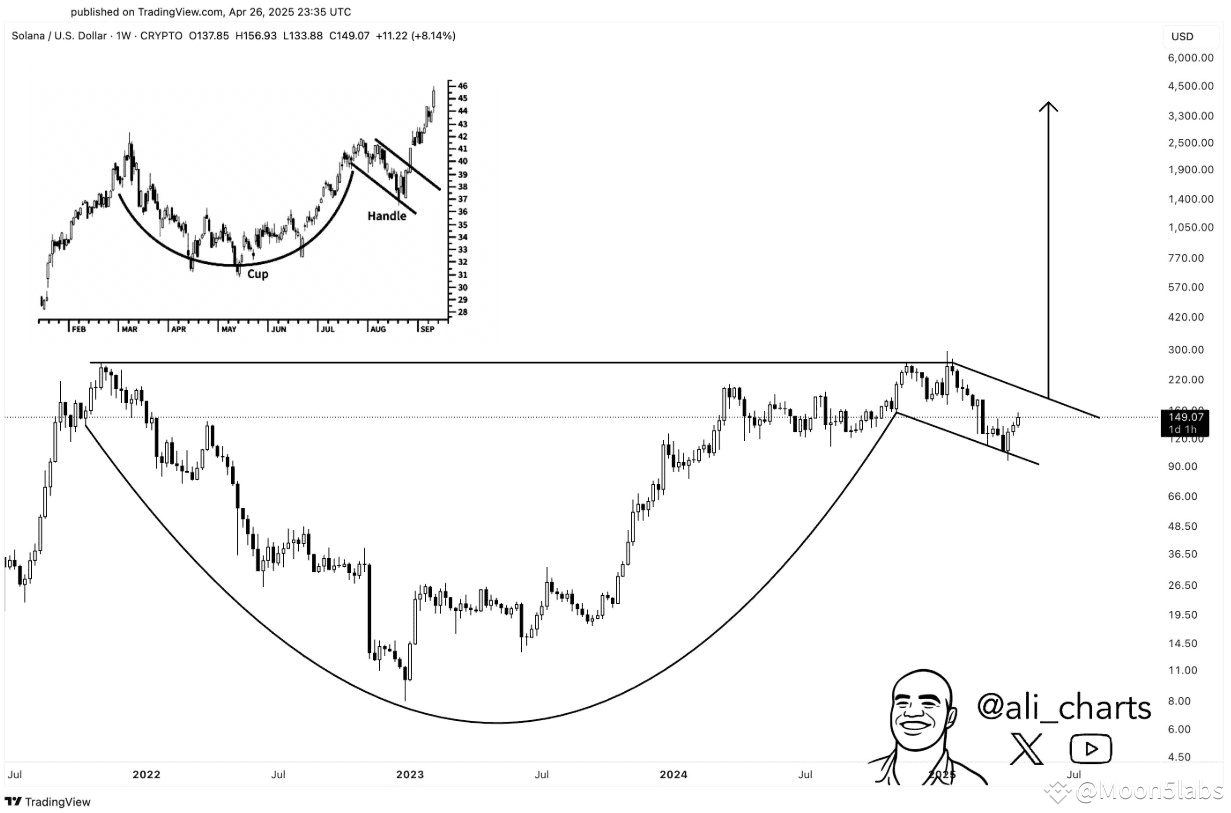
Ali Charts based his forecast on the emergence of a cup and handle formation on Solana’s weekly chart — a bullish pattern in technical analysis.
If SOL can break through the “handle” resistance and hold above it, the next leg up could begin, possibly aiming as high as $4,500.
For now, though, SOL faces strong resistance and remains stuck between $145 and $152.
❗ Why Solana Hitting $4,500 Isn’t Likely (Yet)
Although the projection sounds exciting, market data suggests otherwise. Here are the top three reasons why a price surge to $4,500 is unlikely in the near term:
1. Fading Meme Coin Hype
Solana benefited massively from the meme coin craze on its blockchain — but that hype may be fading.
According to deFiLlama, trading volume on Solana DEXs plummeted from $20 billion to just $6 billion in a matter of days — a red flag that could indicate the start of a bearish phase.

2. Social Media Buzz Is Dying Down
Santiment data shows that mentions of SOL on social platforms dropped sharply — from 2,579 to just 165.
This points to lower retail interest, which historically aligns with weak price momentum.
3. Negative Funding Rates
According to Coinglass, funding rates have turned negative, meaning that traders are opening short positions, betting on the price to fall.

🔄 Solana Enters a Consolidation Phase
After a strong rally earlier this month, Solana has shifted into sideways consolidation, trading between $145 and $152.
Without renewed buying pressure, the token remains stuck in this range.
The RSI indicator is currently above 50 and climbing, suggesting modest bullish momentum. If it continues upward, SOL may break above $152 and target the $179 resistance level.
However, if RSI falters and dips below 50 again, it could trigger a bearish breakdown.

📉 Summary: What’s Next for Solana?
While technical patterns may point toward a potential long-term surge to $4,500, short-term reality looks much less explosive:
🔹 Trading volume is falling
🔹 Retail interest is fading
🔹 Futures markets are leaning bearish
So for now, Solana is more likely to remain in a tight consolidation zone, and it will need stronger catalysts to trigger a breakout rally.
#solana , #CryptoAnalysis , #CryptoPredictions , #sol , #blockchain
Stay one step ahead – follow our profile and stay informed about everything important in the world of cryptocurrencies!
Notice:
,,The information and views presented in this article are intended solely for educational purposes and should not be taken as investment advice in any situation. The content of these pages should not be regarded as financial, investment, or any other form of advice. We caution that investing in cryptocurrencies can be risky and may lead to financial losses.“