**SIGN/USDT** here’s a technical analysis and explanation of potential trade signals, including entry point, stop-loss (SL), and take-profit (TP):
### **Key Observations:**
1. **Current Price:**
$0.07424 — a significant **+147.47% gain**, indicating a strong upward momentum in the last 24h.
2. **Volume Surge:**
24h Volume:
- SIGN: 1.50B
- USDT: 117.88M
This high volume confirms strong market interest and volatility.
3. **Price Range (24h):**
- **High:** $0.08888
- **Low:** $0.03000
A wide range, showing high volatility.
4. **MA Lines (Moving Averages):**
- **MA(5):** 342,460
- **MA(10):** 514,147
- **MA(60):** $0.07530 (Price is just below this, suggesting potential short-term resistance)
5. **Short-Term Trend:**
Price is fluctuating around $0.07418 with visible pullbacks after a strong rally, indicating potential **profit-taking or a pause** in bullish momentum.
---
### **Trade Signal Strategy**
#### **Entry (Buy):**
- **Entry Price:** Around **$0.07400**
This is slightly below the MA(60) and near a recent support zone. Enter only if price consolidates and shows a bounce.
#### **Stop-Loss (SL):**
- **SL:** Around **$0.06800**
This is ~8% below current price and under recent pullbacks, protecting against downside risk if momentum fades.
#### **Take-Profit (TP):**
- **TP1:** $0.08000
Conservative target just before the psychological resistance of $0.080.
- **TP2:** $0.08800
Aggressive target near 24h high, if bullish trend resumes.
---
### **Technical Signal Summary:**
| Indicator | Signal |
|----------|--------|
| Volume | Strong Bullish |
| MA Trend | Neutral (price near MA60) |
| Short-Term Trend | Possible Pullback |
| Momentum | Fading slightly, caution advised |
---
### **Conclusion:**
**Signal:** _Cautiously Bullish with SL and TP planning_
You can consider entering a position if the price holds above $0.074 and shows signs of upward continuation. Use proper risk management due to recent volatility.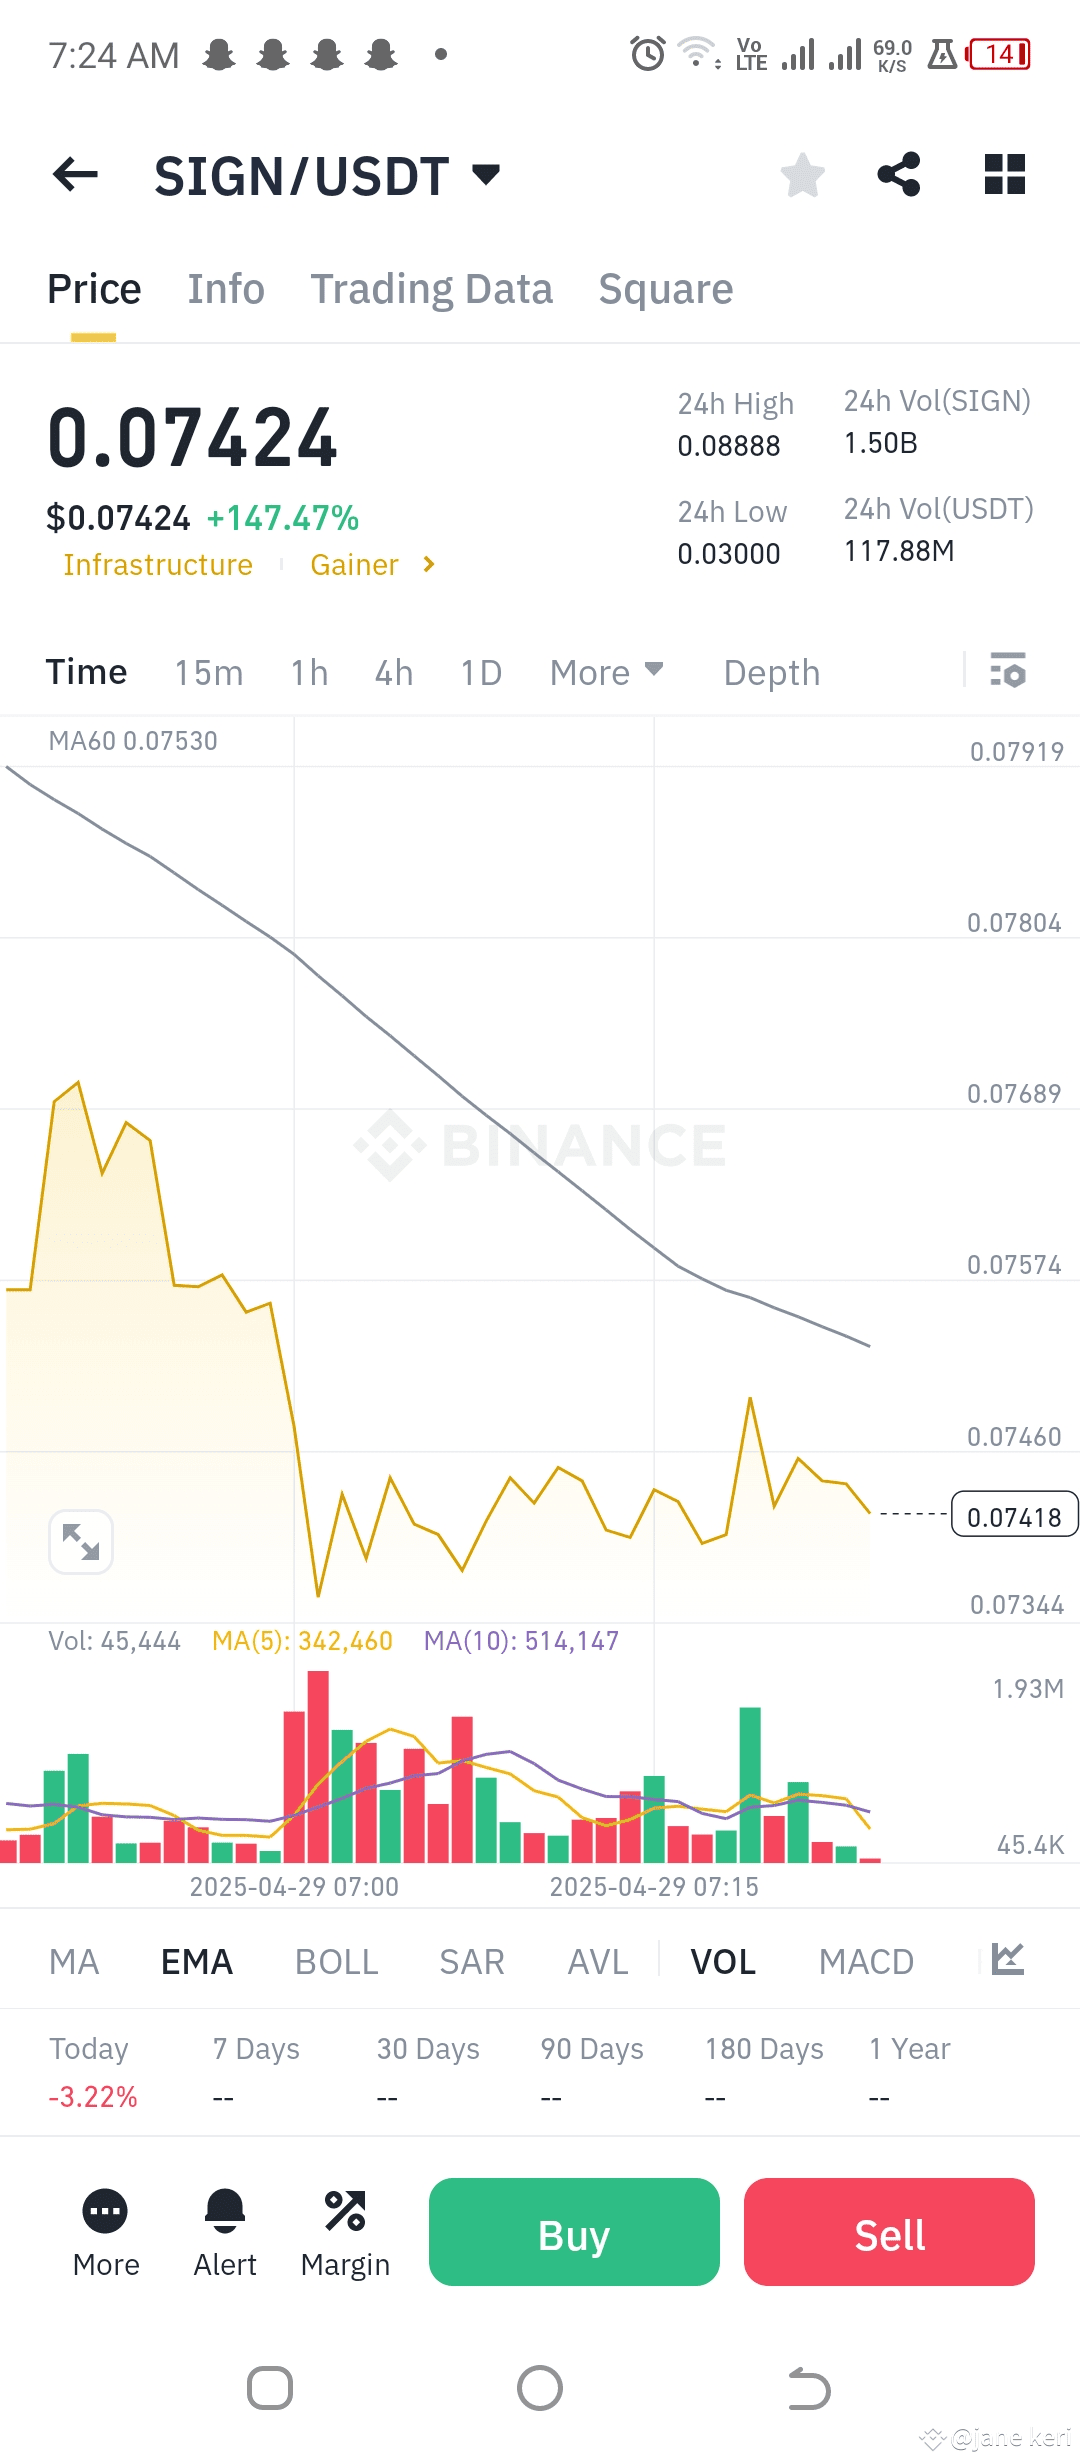
#BTCRebound #SaylorBTCPurchase $SIGN