The weekly chart shows a bullish candle with a long upper shadow and a short lower shadow, with trading volume equal to the previous week. The weekly chart is currently in a three consecutive bullish trend. The MA30 line on the weekly chart has shifted from an upward trend to flat, and the price is below the MA30 line. After the MACD crosses below the zero line, it returns to the zero line, showing a trend of weakening downward momentum. The weekly level is still likely to oscillate in a larger cycle in the range of 120-180.
The daily chart shows a small bearish candle, with trading volume unchanged from the previous day. Liquidity is poor over the weekend, maintaining a trend of decreasing volume and downward oscillation. It is currently in a three consecutive bearish pattern.
The MA30 line on the daily chart has begun to turn upward, and after the MACD crosses above the zero line, it shows a trend of weakening upward momentum.
Compared to Ethereum, SOL is less affected by Bitcoin and maintains its independent trend. It is still oscillating downward; a rebound will only occur after testing support. The support level provided yesterday was 144, and a rebound occurred when it reached around 145. The next opportunity for a short-term long position can be considered around 140.
For spot trading, buy on dips at the support level on the daily chart and sell at the resistance level on a larger scale to make significant swings.
Daily chart resistance levels are 160-172-183-204, support levels are 139-127-112-98-82.

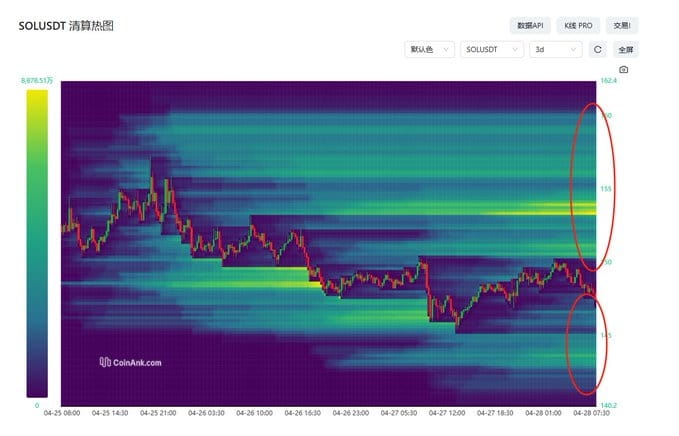
From SOL's liquidation heatmap data, it can be seen that
the price is rising, with a large number of significant and ultra-large short positions waiting for liquidation in the 150.2-160.4 range.
the price is falling, with a large number of significant long positions waiting for liquidation in the 146.8-142.8 range.