In the cryptocurrency circle for ten years, trading professionally for six years, over 3100 days. I have practiced long-term, short-term, ultra-short, and swing trading, and have used almost every type of method, so I have a say in this matter.
I have always said that mastering a skill requires the 10,000-hour rule. Eight hours a day and over 200 days a year for nearly five years of backtesting is just the beginning, the foundation for stable profits. Many experts who have traded from tens of thousands to hundreds of millions only opened contracts with large multiples, and many have suffered losses in a bear market, but you just don’t know it. Human nature often causes people to lose their ability to make correct judgments in the face of large trends.
Returning to the main topic, I will share with you next:
In cryptocurrency trading, it is difficult to change others, and it is difficult to change oneself; but only by changing oneself will there be hope!
It's hard to change others, and it's hard to change oneself;
But only by changing oneself will there be hope.
The financial market never has 'what ifs'; it only sees results!
If we cannot achieve results in cryptocurrency trading, we must have done something wrong.
Being able to consistently achieve results means you have done something right, and that's all.
Mindset influences our daily actions, and daily actions lead to the final outcome.
Losing money is not scary; what is scary is not finding the real cause of the loss and failing to make the decision to change immediately, which can help us turn losses into profits.
It is most frightening not to ignore problems, to avoid problems, or to not confront problems directly and solve them.
Everything has cause and effect; sow good causes and reap good results, sow bad causes and reap bad results.
Our current situation is entirely derived from every decision we made in the past.
Regardless of whether the outcome is good or bad, we must endure it. In the world of adults, once you choose, even if you are wrong, you must kneel and walk to the end.
It just depends on whether we can calmly accept and face the final results as they correspond to each person.
In the world of adults, do not pretend that the process is very hard because the final result will not accompany us in the act.
We must learn to reflect and summarize more in our daily lives. Keep improving the good, change the bad immediately, and in time, we will all get better.
The same is true for trading in the cryptocurrency circle; one must abandon the mentality of luck, abandon the desire for quick wealth or speculation, and abandon every trade outside one's ability and understanding.
Before every trade, ask yourself whether you truly understand the situation, whether you have solid grounds for your trading decisions, whether you have prepared a strategy, established a risk control system, and whether you can accept failure, etc.
Truly clarifying one's own abilities is an essential element for us to be qualified investors.
As long as you want to change, anytime is just right!
Guí Yǎn teaches you to learn to read naked K lines in 5 minutes, accurately judging buying and selling points!
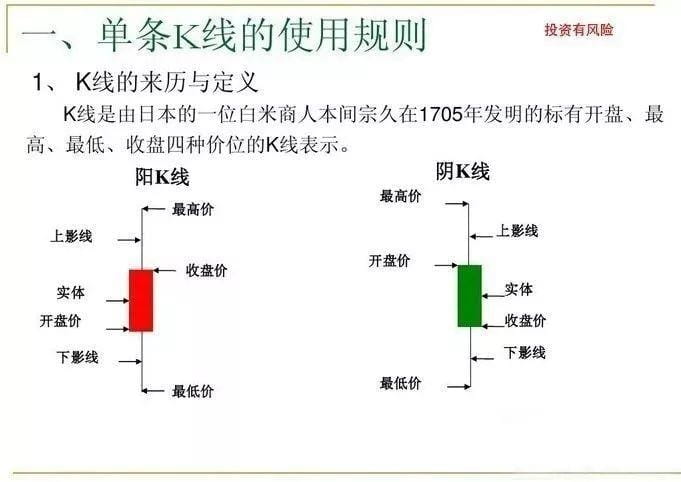
Candlestick charts, also known as K-line charts, Japanese candlesticks, yin-yang lines, etc., are commonly referred to as 'K-lines'. They originated from rice market trading during Japan's Edo period (1603-1867) to calculate daily rice price fluctuations. Due to their unique drawing method, they were introduced into price trend analysis and have been widely used in TD, futures, foreign exchange, options, and virtual currency markets after more than 300 years of development.
The candlestick chart contains rich Eastern philosophical thoughts, expressing the mutual transformation of the 'force' between both sides through the change of yin and yang.
Candlestick Chart: A single candlestick records the price changes in the cryptocurrency market within a day. Arranging the daily candlesticks in chronological order forms the historical price movement, called a candlestick chart.
Price levels consist of opening price, closing price, highest price, and lowest price. If the opening price is lower than the closing price, it is called a bullish candle; conversely, it is called a bearish candle. The rectangle in the middle is called the body, the thin line above the body is called the upper shadow, and the thin line below the body is called the lower shadow. Candlesticks can be divided into daily, weekly, and monthly candlesticks, and minute and hourly charts are also commonly used in analysis software. Candlesticks are a special market language, and different forms have different meanings.
Candlestick drawing method: using trading time as the x-axis and price as the y-axis to continuously draw daily candlesticks to form a candlestick chart.
In candlestick charts, there are bullish and bearish candles. Generally, red candles represent bullish candles, while green candles represent bearish candles. If the closing price during the period represented by the candle is higher than the opening price, indicating a price increase, the candle is drawn in red; if the closing price is lower, it is drawn in black. If the opening price equals the closing price, a doji appears.
So what does the candlestick chart look like, and how do you read it? Please take a close look at the image below!


What do naked K traders analyze?
Naked K analysis mainly has four modules: trend, position, momentum, and signals.

These four major analysis modules do not exist independently; they are interdependent and complement each other.
In the face of complex and ever-changing market trends, if we can analyze from these four major modules, it can make our analysis relatively holistic and comprehensive, preventing us from blindly opening positions upon seeing a trading signal, which is a common bad habit among many beginners.
How to judge trends?
When it comes to trends, remember a few keywords: structure, direction, level.
The judgment of naked K trends primarily relies on the theoretical definitions of trends.
From a structural perspective, a gradual rise in significant highs and lows is identified as an upward trend, while a gradual decline in significant highs and lows is identified as a downward trend. The movement between highs and lows is called a consolidation trend.

Image (2)
In trend judgment, the biggest difficulty lies in the division of levels and the transition of trends.
The division of trends at different levels involves the issue of primary and secondary rhythms. Beginners are easily influenced by small-level trends, often neglecting the main trend, leading to confusion in trading direction. The transition of trends is not easy to judge as it doesn't have absolutely quantifiable standards.
To solve the issue of size levels and trend transitions, my method is to define your main trend and critical points.
Because the starting point of trend selection is different, your perception of the trend direction may not be the same as others. So you need to define your own trend divisions, identify its main trend, and then find the critical points of each trend level, which are usually horizontal lines and trend lines.
Is the price position high or low?
Keywords for position: support level, resistance level, profit-loss ratio.
Why do you chase highs? Why do you always make small profits and large losses? It relates to the judgment of the price position.
If you always go long at resistance levels and short at support levels, this not only results in a high failure rate but also a low profit-loss ratio.
Position judgment is also very important; is the price high or low? My basic measuring standard:
Support levels belong to price lows.
Resistance levels belong to price highs.
Because the take-profit settings are also based on support and resistance levels, so:
Buying at support levels and selling at resistance levels maximizes the profit-loss ratio for going long.
Buying at resistance levels and selling at support levels maximizes the profit-loss ratio for shorting.
Unless you are trading a breakout, all long positions at resistance levels are considered high-level entries, and all short positions at support levels are considered chasing a drop.

This is based on support and resistance levels to determine the price's highs and lows. If you add the concept of trend, how would you judge the position's highs and lows?
How to judge the strength of momentum transitions?
Keywords for momentum: trend movement, candlestick patterns, slope.
Momentum can be said to be the cornerstone of trend movement; without momentum, there is no existence of trends, so momentum analysis is also a very important module.
What is strong momentum, and what is weak momentum?
Strong momentum: trend movement, consecutive bullish and bearish candles, large bullish and bearish candles, large slope.
Weak momentum: range movement, doji, small bullish and bearish candles, small slope.

In an upward trend, the bullish momentum must be stronger than the bearish momentum.
In a downward trend, bearish momentum must be stronger than bullish momentum.
In a narrow oscillation range, it indicates that the bears and bulls are in a state of equilibrium, where narrow fluctuations represent an energy accumulation trend.
The transition from trend movement to range movement indicates a transition from strong to weak momentum.
The movement from a large bullish candle to a small bullish candle indicates a weakening bullish momentum.
A decreasing slope indicates weakening momentum, and vice versa indicates strengthening.
The above is based on trend and price candlestick patterns to judge the changes in price momentum strength, thus determining the direction of future price movement.
So, if you add position analysis, what special changes are there in the assessment of momentum strength?
Is it reliable to enter the market based on signals alone?
Keywords: trend, position, momentum.
When it comes to signals, many of us only think of hammer lines, engulfing lines, and similar starting signals.
When it comes to trading signals, they must be based on the three major modules of trend, position, and momentum. If you analyze signals without the preceding three modules and directly enter trades based on signals, you will find that the success rate is not high. This is why it is repeatedly emphasized that trading signals cannot be divorced from market conditions.
Personally, sometimes I do not always wait for trading signals to enter the market; that's because I already have a good grasp of the price's trend, position, and momentum.
In conclusion, this article explains the four major analysis modules of naked K, each of which covers many knowledge points. This requires you to have a solid foundation, but in any case, the four modules provide a large framework for analysis. If we haven't found a direction in analysis and trading, we might as well sort out the market from these four major modules.
In addition, there are several other key technical levels worth noting:
1) Psychological support and resistance points—usually integer exchange rates, such as 1.00, 1.10, 1.20, etc. Many traders tend to set orders near these integers.
2) Fibonacci retracement levels—used to find potential levels and trends for price retracement. When used on higher time frames, significant Fibonacci levels (like the 61.8% retracement level) can become key technical levels where there may be a large number of open orders.
3) Pivot Points—Pivot points are the market direction reversal points within a day. By simply calculating the previous day's highs/lows and closing price, a series of points can be obtained, which may form key support and resistance lines. Range traders can use the pivot point system to confirm potential reversal points, while breakout traders can use the pivot point system to confirm key breakout positions.
4) Dynamic support and resistance points—key technical levels are not necessarily fixed; they can also be dynamic. Moving averages are often used to determine dynamic key technical levels that appear near the 50-day EMA, 100-day EMA, 200-day EMA, or Fibonacci EMA levels (such as 144-day EMA).
5) Fusion areas of support/resistance—these areas are where different important technical levels intersect. For example, an upward trend line may provide support at a horizontal support level. This will form a fusion support zone of the upward trend line and horizontal support.
Guí Yǎn will share three useful Price Action trading models (practical tips).
Beginner traders often think that Price Action is limited to a few simple candlestick combinations, such as fakey bars, pin bars, outside bars, etc. This is a very one-sided and superficial understanding. This article shares several trading models used by professional traders; associating with experts will broaden your horizons.
Model 1: False Breakout.
False breakouts are often used in oscillating ranges and are the best model for buying low and selling high, commonly used for range reversal trading. A strong reversal candle forms at the swing low, and after the price breaks through support and resistance levels, a strong reversal candle forms again. This model can be determined as a false breakout, and one should go short after this candle closes.


Model 2: Reversal Structure.
When the price at the resistance level stops making new highs and forms lower highs and lower lows. Lower high, lower low. Enter short after the price breaks below the lower low. This is a standard reversal structure.


Model 3: Pre-Breakout.
A narrow oscillation structure forms at the boundaries of key support and resistance levels, which is a precursor to price breakout. The pre-breakout model is favored by professional traders.


Judgment of the accumulation phase in trading! (practical tips)
Methods for judging the accumulation phase of futures through technical analysis:
1. Observe price patterns: If the price rises and falls continuously within a narrow range for several days, forming a picture similar to building foundation piles, this is called a dense area. This may indicate that the market is accumulating strength, and once it breaks upwards or downwards, it may trigger a significant move.
2. Analyze trend lines: pay attention to the angle and stability of the trend lines. A 45° angle trend line may have more reference significance. A steep trend line, even if broken, does not necessarily represent a trend reversal; it may just be a normal adjustment; while a gently sloping trend line indicates weaker trend strength.
3. Use of moving averages: Simple moving averages, such as ma60, can be used to judge bullish or bearish directions. If the price is running above the moving average, it may be in the accumulation phase of an upward trend; conversely, if it is below the moving average, it may be in the accumulation phase of a downward trend.
4. Trading volume and open interest: Trading volume represents the activity level of market participants, while open interest reflects views on future market direction. During the accumulation phase, changes in trading volume and open interest can also provide clues. When open interest gradually increases during the accumulation process, it may suggest that market participants are increasingly aligned in their views on future direction.
5. Pay attention to technical indicators: such as MACD, KDJ, RSI, etc. Although these indicators have certain limitations, they can reflect market momentum, overbought and oversold conditions from different angles. However, a single indicator's signal may not be accurate, so it is essential to combine multiple indicators for comprehensive judgment.
6. Time factor: There is a saying that 'time exchanges for space'; a breakout formed after a long period of sideways consolidation or triangular consolidation may be quite fierce, and its amplitude and speed may be proportional to the length of the consolidation period.
7. Signs of reversal patterns: Although a complete reversal pattern has not yet formed, be alert to some early signs. For example, in an upward trend, the length of bullish candles gradually shortens, or there are bearish candles with long upper shadows that open high and close low; in a downward trend, bearish candles gradually shorten or open low and close high.

The most profitable trading pattern on sunny days: [Second Strike Pattern] Today, I will share the key details!
Images and text combined provide significant help to both novices and veterans!
1. There is a pattern that is 'simple and easy to use' with a high success rate for bottom fishing and top touching!

That is the 'second strike pattern'!
Keep looking down⬇️

In the image below⬇️, the bulls' first strike had very average strength.

The image below⬇️ Pay attention ⚠️
A long bearish candle has broken through, and it's a clear head; the short position remains strong, which actually suppresses the bulls, temporarily unfavorable for a second counterattack by the bulls.

To establish an advantage, the bulls must take another city and capture the small high point above.
Note: A long bullish candle rises, engulfing the previous long bearish candle.
In the current situation, it can only be said that the bulls have temporarily regained lost ground, resulting in a stalemate!

The image below⬇️ Unfortunately, a bearish candle has broken through again, and the bulls still couldn't hold on!

The image below⬇️ Small bullish candle = slightly weak.
When the two strike points are far apart, it is difficult to form a mutual support effect!

The image below⬇️
The emergence of a long bullish candle is the true confirmation of the second strike pattern.
However, the losses that should have been incurred have already been incurred, but it still can't drop further.
Regardless of the speed or magnitude of the drop, it is very small, indicating that the bears are extremely weak.

Second Strike Pattern:
1. The best initial strike should contain a medium to long bullish candle, with turbulence being second best, but it cannot be both consolidation and small candlesticks.
2. The second counterattack must be strong; ideally, a long bullish candle can return above the previous low point, with a medium bullish candle as second best. Like the example in the image below⬇️, a long bullish candle directly breaks through the previous high point of the first rebound, and that would be a strong one!

What is the highest realm of trading cryptocurrencies?
The highest realm of trading cryptocurrencies is to hold coins, and only to hold Bitcoin and Ethereum!
Just this one sentence: if you can truly achieve it, I guarantee that you will make a profit in the cryptocurrency circle.
What bankruptcy, liquidation, retreat from the market, or jumping off a building has nothing to do with you; regardless of whether Bitcoin rises or falls in the short term, no matter how volatile it is, you remain calm and look at life with a smile.
Because you know that the essence of finance is a cross-temporal value exchange, short-term profits and losses are not very significant.
Unless you have been in the market for many years, you have seen too many people get rich quickly only to go bankrupt later!
You have seen too many speculators thinking they are different from others, and you have seen too many traders thinking they are geniuses, believing themselves to be Wall Street wolves.
The result is that I am left with nothing…
Respect the market rules, respect human nature, respect your opponents. These three respects are the secrets to my persistence in the cryptocurrency circle for eight years, and they are also what I want to share with everyone.
Once you have experienced the vast ocean, you can't consider anything else water. The above are some of my insights from ten years of trading cryptocurrency, heartfelt words, and I have walked many winding roads to gradually understand. Hello everyone! I am Guí Yǎn, and today I want to share a summary with you, hoping to help you with your understanding and mindset in cryptocurrency trading!

