Behind most of the data I share, there is an objective logic support, whether it is the chip structure, the turnover cost, or the holding time, etc. Based on these data, we can analyze the emotions and psychology of different groups of investors (LTH/STH) to determine the changes in trends and cycles. Only this "three-line integration" indicator, I define it as a "magical" metaphysical indicator.
The essence of this indicator is to use the BTC halving day as the starting point of time. When the MVRV trends of nearly three cycles are superimposed together, we will find that the trends of the three curves are highly synchronized. Friends who have read my top tweets should know that the reason why it is called "magical" is because it is very accurate! The reason why it is called "metaphysical" is that there is no objective logical support behind it.
It once accurately gave the location of the historical bottom of this cycle, and that a rebound (from 16,000 to 30,000 US dollars) would occur in 5-6 months (ie June 2023).
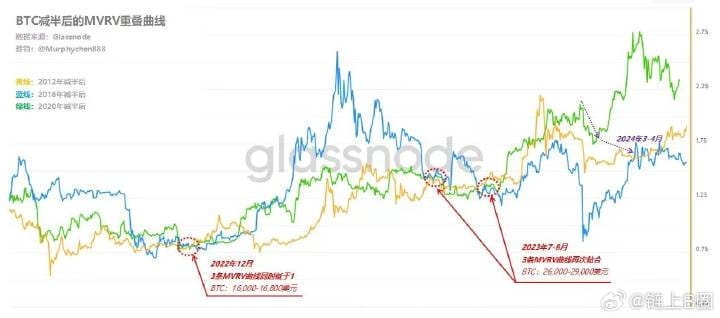
Whenever the three lines stick together, it is an important time node. For example, in December 2022, the three MVRV curves stick together for the first time and are lower than 1 at the same time, BTC enters the bottom of the bear market, and the price consolidates between $16,000-16,800. In July-August 2023, the three curves stick together for the second time, and BTC consolidates in the range of $26,000-29,000, which is also the best position to get on board before the start of this round of bull market.
According to the indicator trend at that time, it was originally expected that the three lines might converge for the third time in March-April 2024. Because the yellow and blue lines have already bonded, the green line will move to the predetermined position along the purple dotted line in the figure, and the green line has already turned downward. However, the unprecedented super positive news of the spot ETF being approved has created this round of atypical bull market, making BTC break through the previous high before the halving for the first time in history.
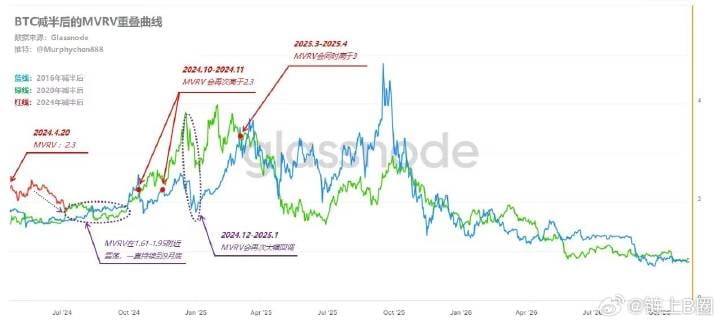
As the saying goes, "Success or failure is due to Xiao He", while ETFs promote sentiment, they also overdraw purchasing power in advance, accelerating the rhythm of the bull market cycle. As can be seen from the above figure, on the first day of halving on April 20, 2024, MVRV started at 2.3, while the previous two cycles were between 1.5-1.8.
There is no market that keeps rising. If it ran too fast in the past, it must take a break now. So we can see that the red line has been moving along the direction of the purple dotted line since May 21, gradually approaching the green and blue lines.
“Three lines in one” seems to be recreating its “magic”!
By carefully observing the trends in the figure, we can draw the following "not so reliable" predictions:
🎈If the red line, green line and blue line can keep the same frequency, it indicates that the MVRV curve will fluctuate around 1.61-1.95, which corresponds to the price of BTC is 49,500-60,000 US dollars. BTC will fluctuate roughly within the upper and lower range of such a channel until the end of September.
🎈It indicates that around October 2024-November 2024, MVRV will be higher than 2.3 again, which means that the price of BTC will once again reach the 70,000 USD mark.
🎈It indicates that around December 2024-January 2025, MVRV will have a sharp correction.
🎈It indicates that around 2025.3-2025.4, there may be a phenomenon of "three lines in one", that is, the three MVRV curves will be higher than 3 at the same time. This may be a top area of this cycle. MVRV is higher than 3, corresponding to a BTC price of around US$93,000 (calculated according to the current RP).
Once again, the above predictions are completely blind guesses, without any theoretical basis, and are only derived based on indicator trends.
Can you combine K-line technology, macro data and your own judgment of the cycle to verify whether the time prompt given by this "metaphysical indicator" is reasonable? Welcome to discuss in the comment area.
