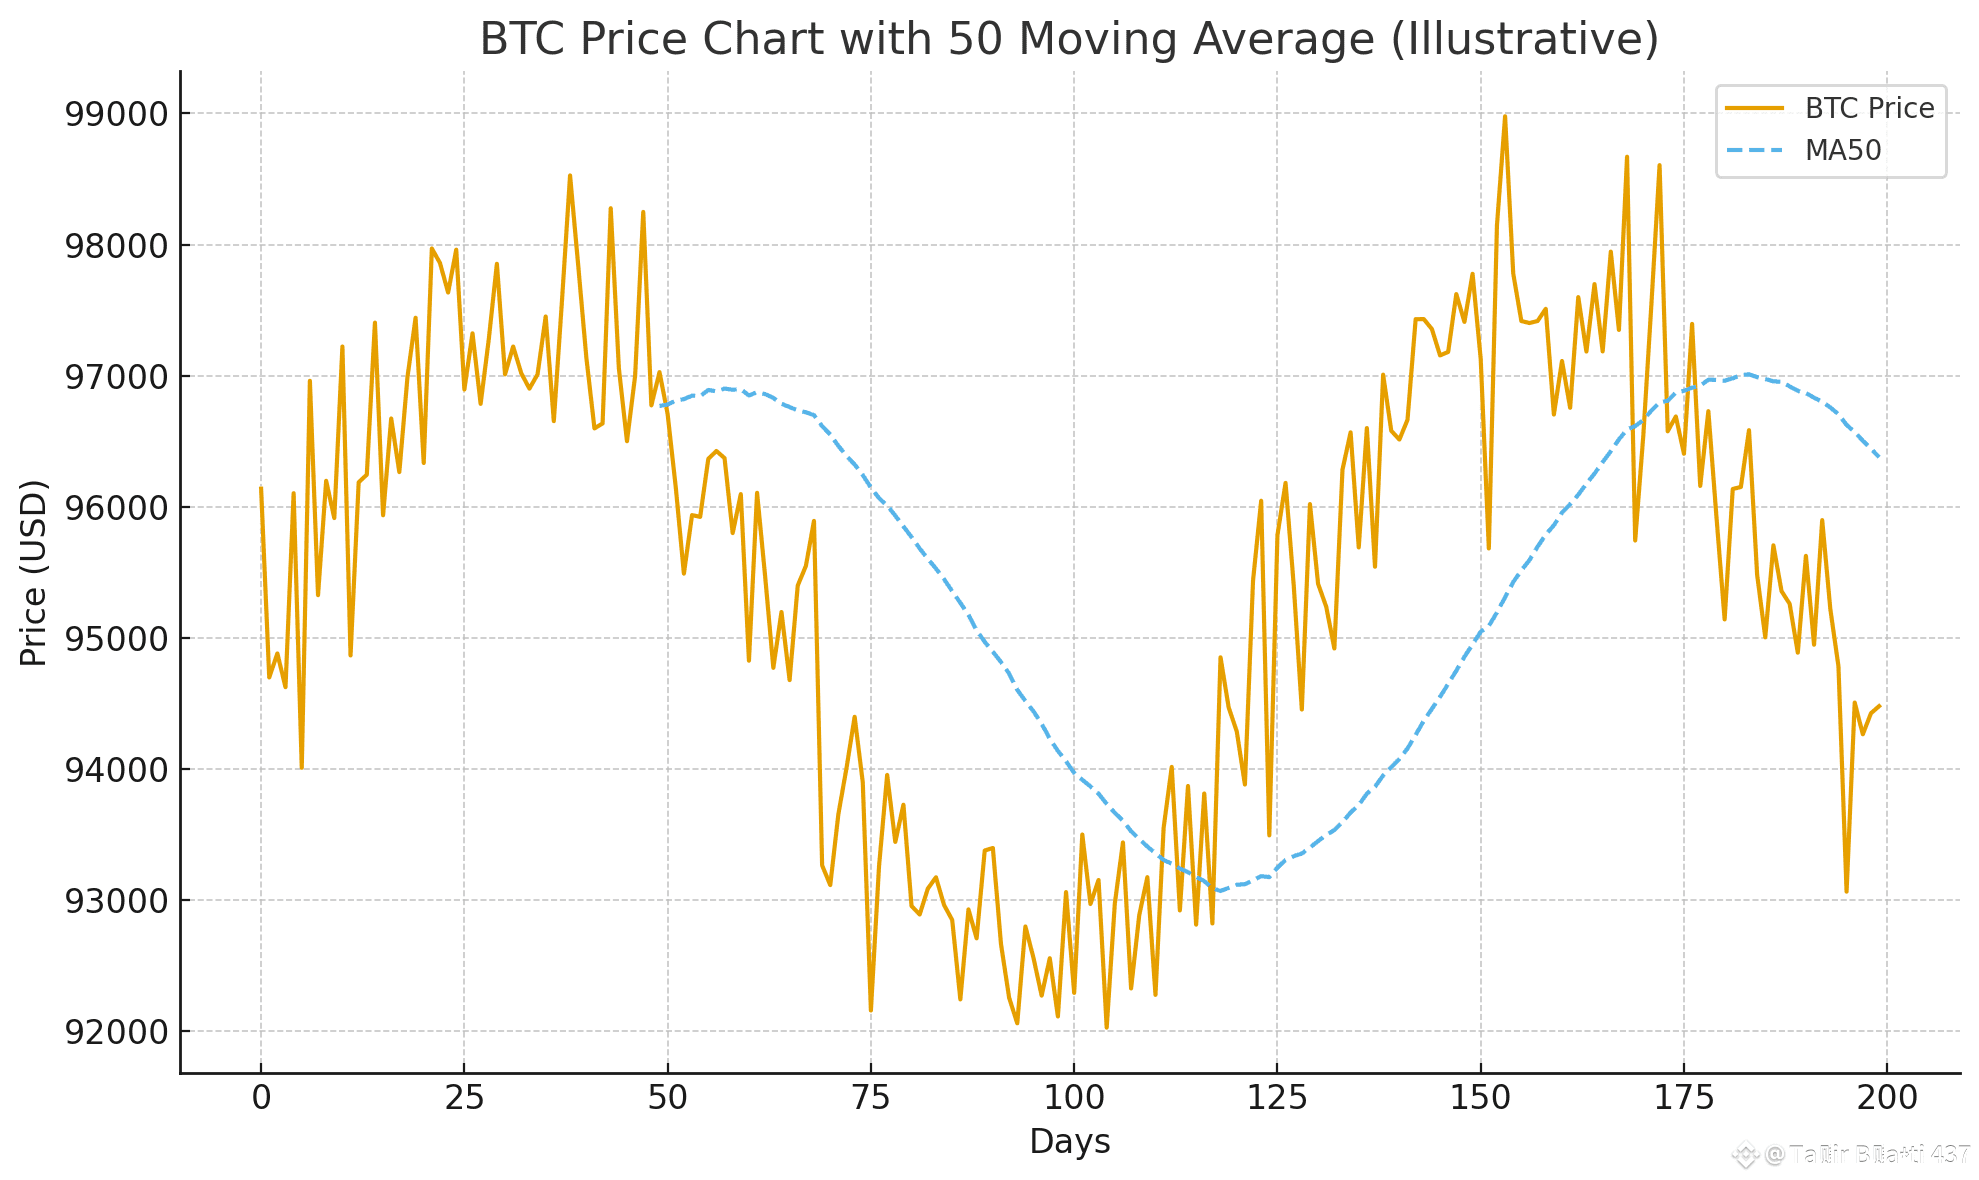
📊 Chart: BTC Bull/Bear Support Zones
The chart above shows:
BTC price trend (illustrative)
Horizontal lines marking the major support levels:
$90,000
$62,000
$54,000
This helps visualize where bulls lose control and bears take over.
---
If you want, I can also create:
✅ A chart with resistance + support
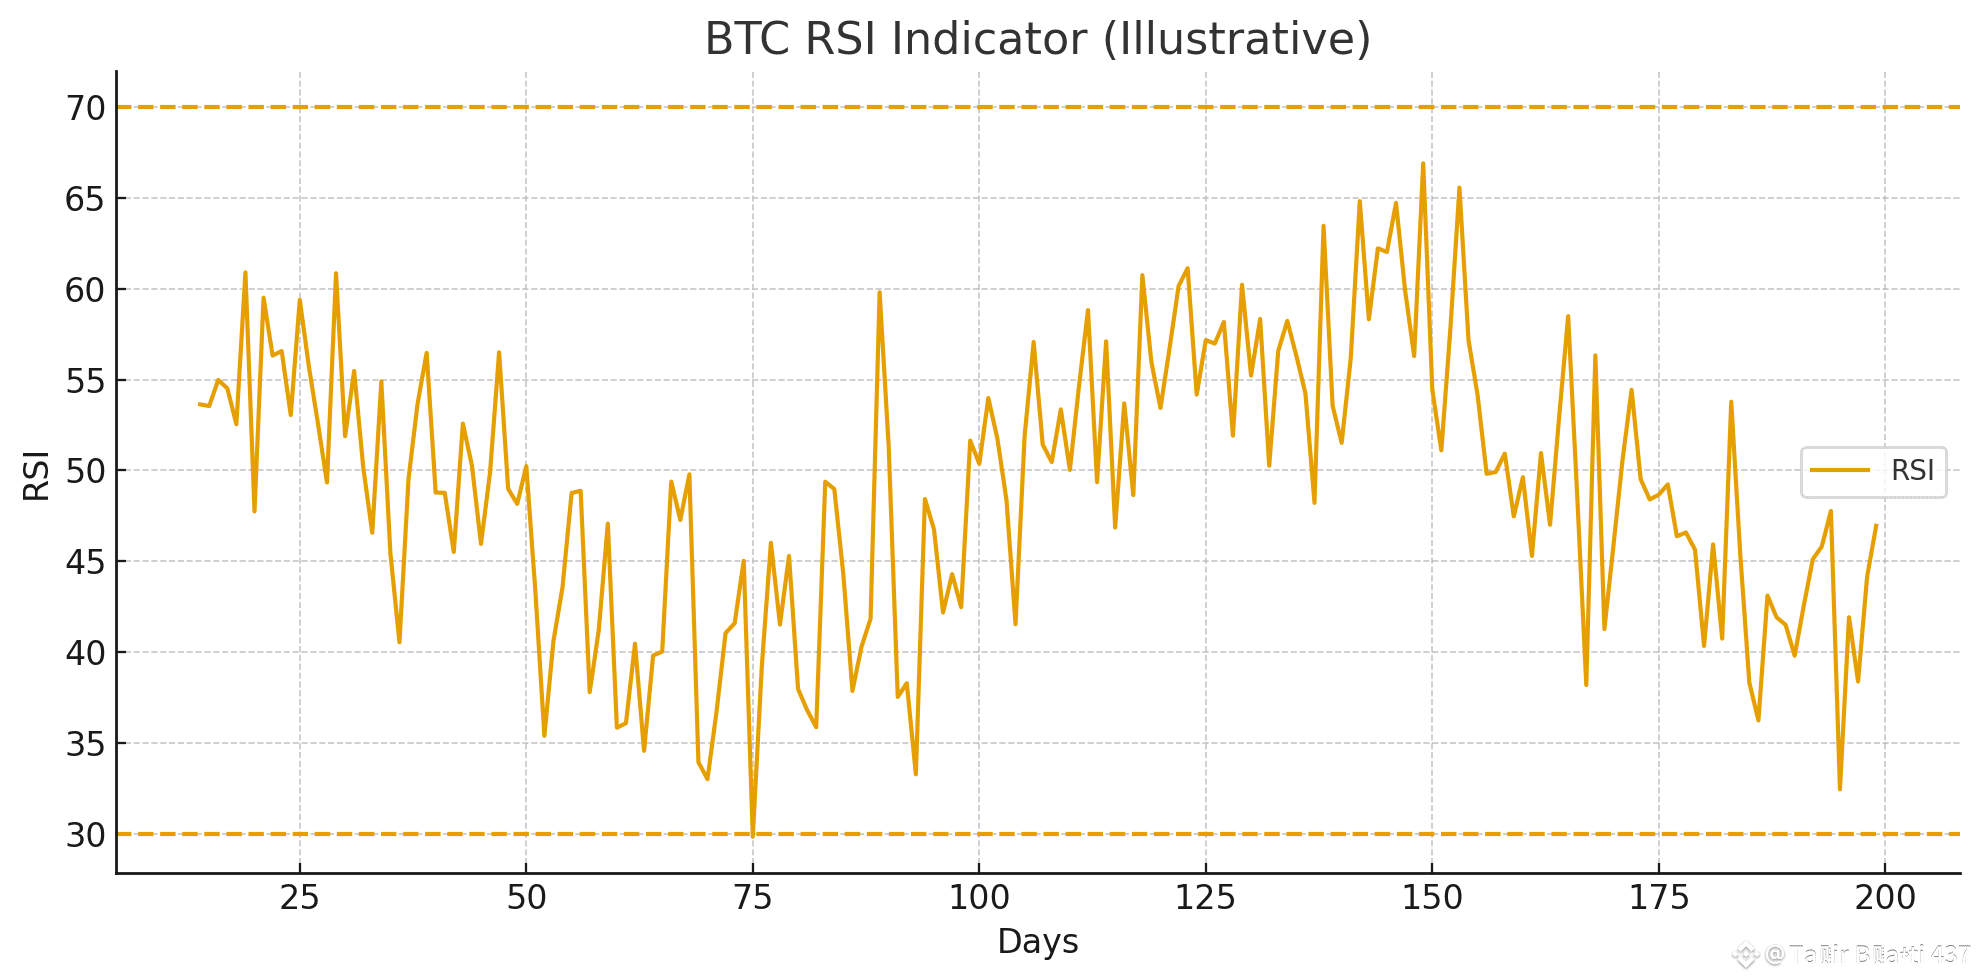
✅ A chart with RSI + MACD
✅ A bull run end-indicator visualization
Or
✅ A price projection for 2025–2026


