
Time Frame: 1 Hour (Intraday/Swing Focus)
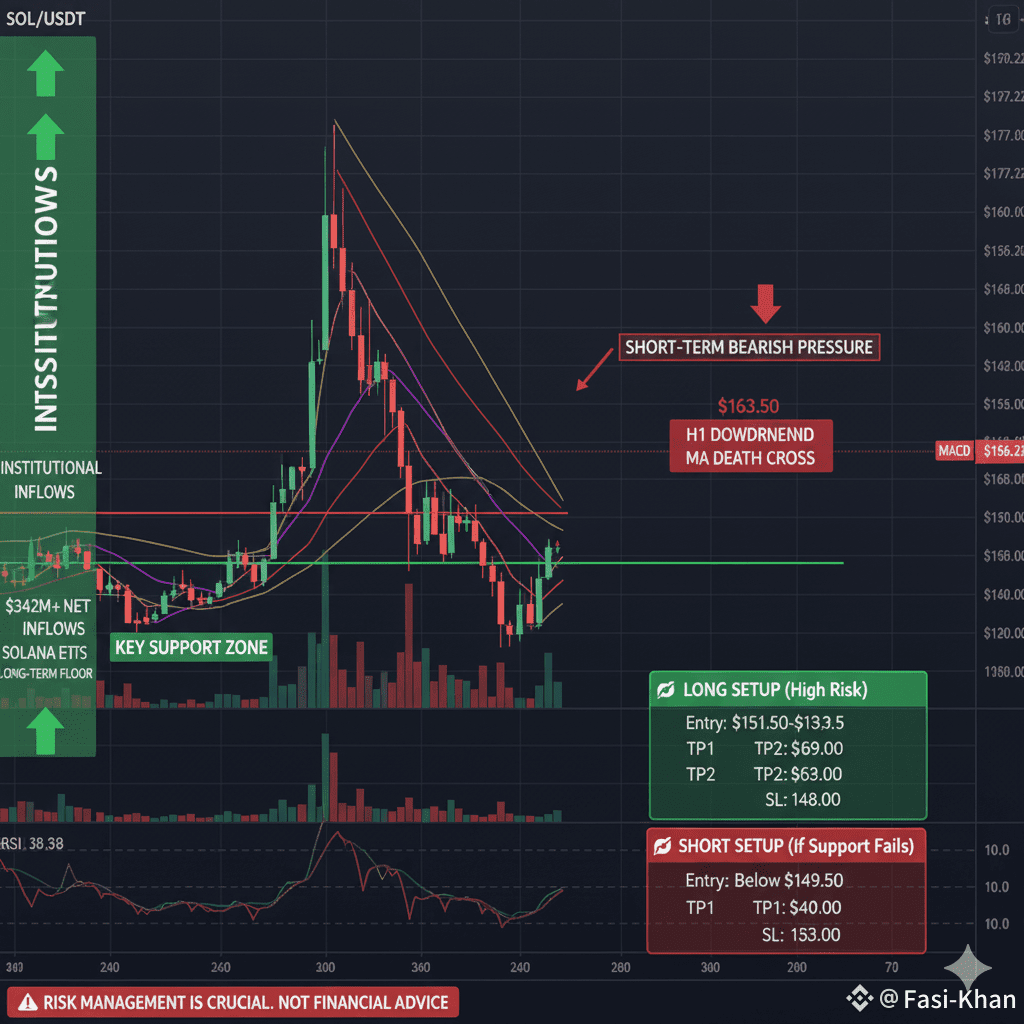
Current Price: Approximately $156.22 (Based on the chart image)
📊 Technical Analysis (TA) Snapshot
The 1-hour chart, indicating a sharp drop from the $170-$171 area down to the current price, confirms a strong short-term bearish correction.
Key Support Zone: The critical support area is identified by multiple analysts between $150 and $155. The price must hold this level to prevent a further correction toward the $140 support.
Moving Averages: The 1-hour chart shows the price is trading below all three moving averages (MA 7, MA 25, MA 99), with the shorter-term MAs crossing below the longer-term MAs (the "death cross" on smaller timeframes), signaling clear bearish momentum in the immediate term.
Oversold Indicator: The Relative Strength Index (RSI) is reported to be around 37-40.28, suggesting that selling fatigue is setting in and the asset is nearing an oversold region, which could precede a bounce.
$SOL Enhanced Technical Analysis (TA)
Bollinger Bands (BB): The price is testing the lower Bollinger Band, which typically signals that the asset is oversold on this timeframe and due for a move back toward the middle band (SMA 20), currently acting as immediate dynamic resistance. The bands are also wide, indicating high volatility following the recent sell-off.
MACD (Moving Average Convergence Divergence): The MACD line is well below the signal line and the zero line, confirming the strong short-term bearish momentum. Crucially, the histogram bars are starting to shorten (or decrease negatively), which is a subtle indication of selling pressure fatigue and a potential bullish MACD crossover forthcoming.
Key Support & Resistance:
Major Support: The $150.00 - $155.88 range is a critical floor, aligning with the 61.8% Fibonacci retracement of a recent major uptrend. Holding this level is essential for mid-term structure.
Immediate Resistance: The first hurdle is the $163.50 level (mid-band of the BB and previous pivot point).
📰 Fundamental Analysis (FA) Catalysts: The Long-Term Bull Thesis
The bearish short-term price action is running contrary to overwhelming fundamental strength, mainly driven by institutional adoption:
Durable Institutional Inflows: US spot Solana ETFs have recorded ten consecutive days of net inflows, amassing over $342 million since launch (reported by analysts). This sustained capital injection is a major factor tightening supply and providing a strong structural floor for the price, validating SOL as a major institutional asset.
High-Beta Diversification: Institutional investors are viewing SOL ETFs as a "high-beta" complement to Bitcoin and Ethereum funds, seeking higher growth exposure within a regulated product.
Ecosystem Resilience: Despite macro volatility, developer engagement and on-chain activity on Solana remain robust, positioning the network for a strong recovery once market sentiment shifts.
📰 Fundamental Analysis (FA) Catalysts
Despite the current price volatility, Solana’s long-term fundamentals remain exceptionally strong, primarily driven by institutional interest.
Massive Institutional Demand: Solana ETFs have seen substantial net inflows (reported at over $323 million to $421 million in recent days/weeks). This institutional capital inflow is a powerful long-term validation and floor for the price.
Ecosystem Growth: Recent news highlights continued growth in the Solana ecosystem, including new partnerships (like with OpenSea for NFT minting) and the rapid adoption of Solana Pay 2.0.
Macro Shift: The recent launch of crypto trading by major national banks (like SoFi) and a more dovish stance from the Fed are seen as positive tailwinds, injecting broader liquidity and legitimacy into the crypto sector, including SOL.
📈 Trading Setup: Counter-Trend Bounce (High Risk)
Given the short-term oversold condition and proximity to a major fundamental support zone, a bounce trade could be considered.
Action Entry Zone (Buy) Take Profit (TP) Targets Stop Loss (SL)
LONG $150.00 – $153.50 TP1: $159.00 (MA 25 Re-Test) $148.00
TP2: $163.50 (0.618 Fib / Previous Pivot)
TP3: $170.00 (Recent High Resistance)
⚠️ Risk Management Note
Disclaimer: This is not financial advice. The current bearish trend on the 1-hour chart is strong. A break and close below the $150.00 psychological support could lead to a rapid continuation down to the next support at $140.00. Always use strict risk management (1-2% of capital per trade).
#solana #TrumpTariffs #USGovShutdownEnd? #TechnicalAnalysiss #TradingSignals