$BNB 🚀 THE SIGNAL IS STRONG: A Complete Analysis
$BNB is showing impressive strength. While most of the market may be undecided, BNB is rising with clear signs that the bullish momentum is in control, and the indicators confirm this..
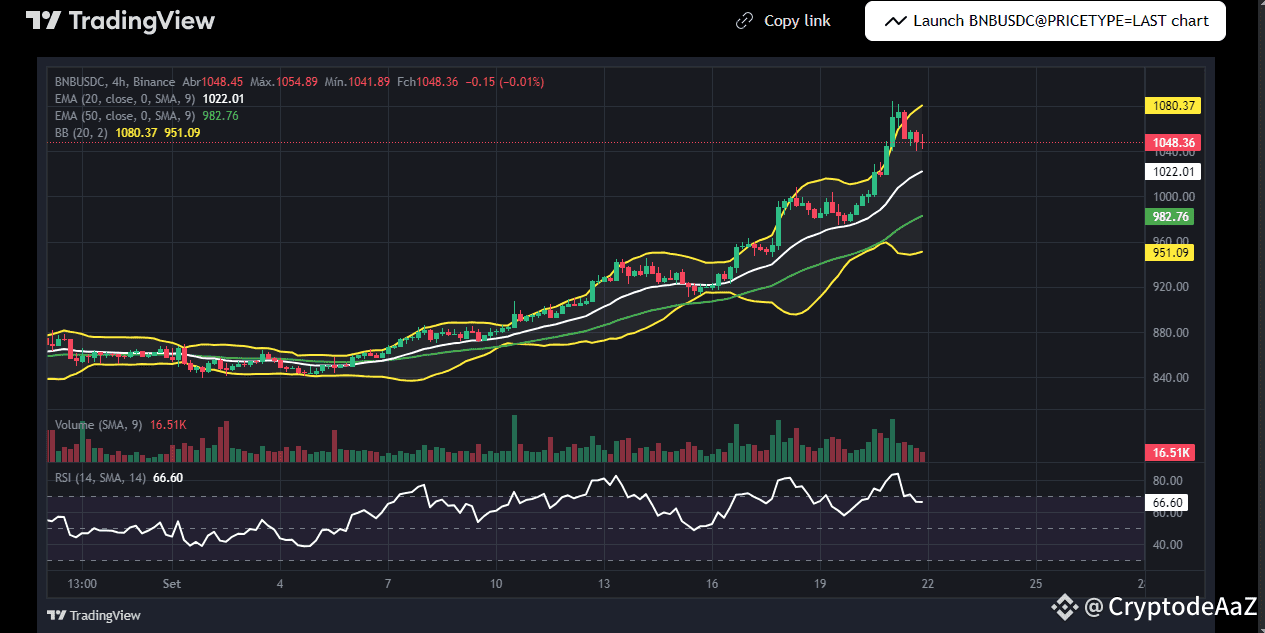
4-Hour Chart Analysis
Trend Momentum: The price is in a clear uptrend, trading well above the 20 and 50 period EMAs. This position above both moving averages is a strong and reliable signal that the uptrend is active.
RSI Buying Power: The RSI is at 66.60, which shows that buying power is strong. The price has not yet reached the overbought zone (above 70), suggesting there may still be room to rise before a correction.
Volatility Validation: The price is not only rising but is "riding" the upper band of the Bollinger Bands. This move is a sign that volatility is expanding in favor of buyers and that the current move has great strength.
Volume Confirms: There was a significant volume increase on the last major rise, which validates the strength of the move and suggests the trend may continue.
What's Your Opinion?
With such an optimistic chart, the question is: will BNB maintain this rise or will we have a small correction soon? Share your analysis in the comments!
