

Bitcoin (BTC/USDT): Navigating this Nightmare :)
2Grab this chart
70
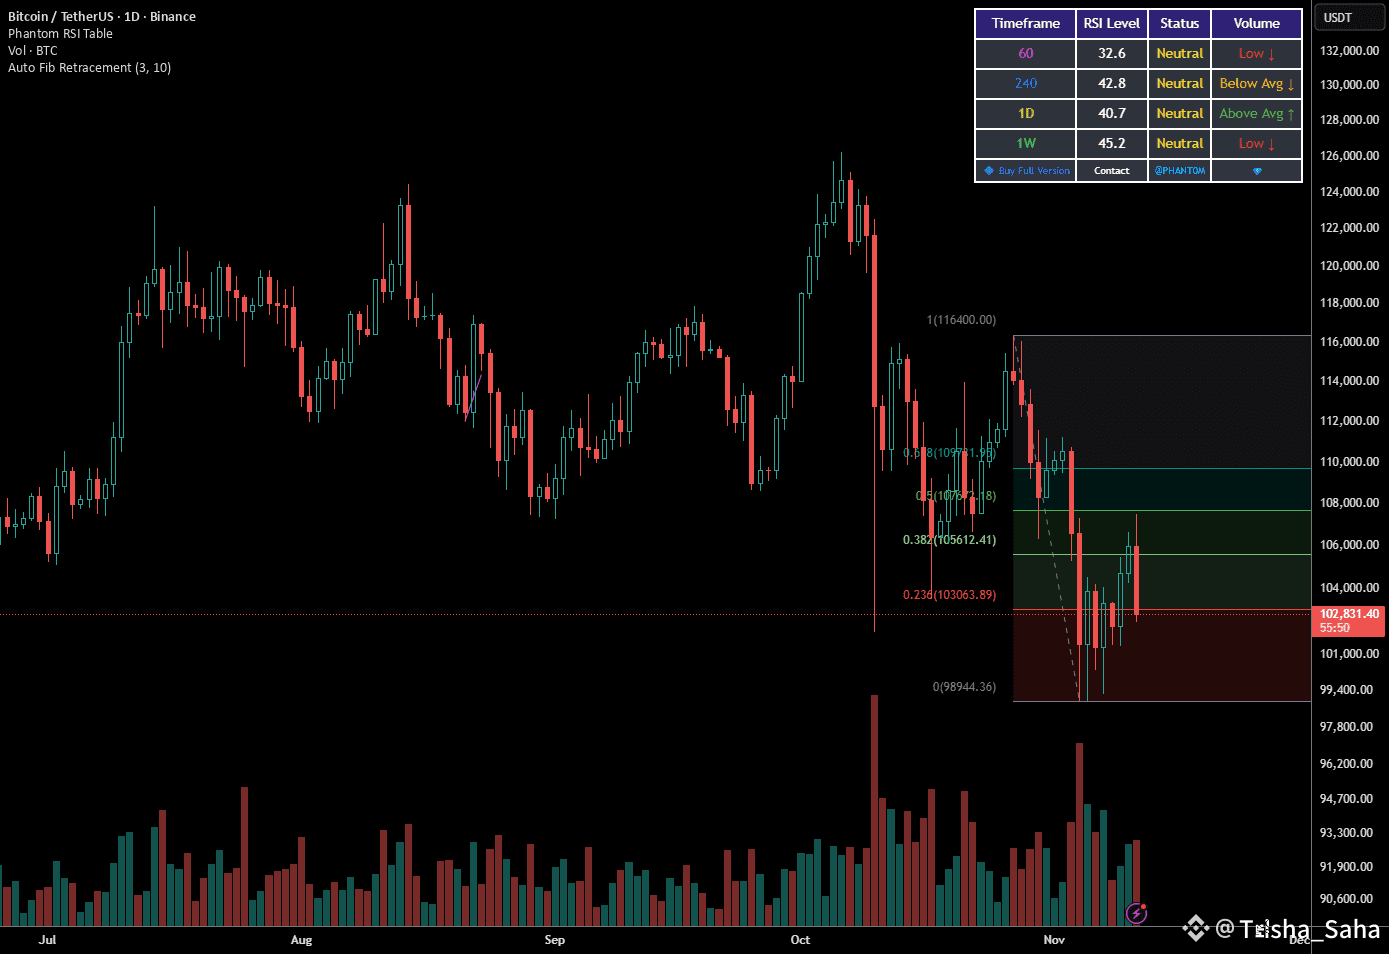
With Bitcoin currently testing the psychologically critical $101,800 - $102,000 area, my multi-timeframe analysis confirms that the asset has entered a short-term bearish phase, defined by a recent major support breakdown. The confluence of indicators suggests aggressive short-term supply pressure, forcing us to prioritize the bearish outlook until key technical thresholds are reclaimed.
Market Context: Bitcoin Dominance (BTC.D 1D) - The Structural Shift
The Bitcoin Dominance chart provides crucial context for the overall market health, currently confirming the risk-off sentiment.
Dominance Strength: BTC.D is trading near 60.0%, having recently risen from a low of 59.5% during the latest price move down. This small, but important, shift in dominance provides a clear signal about capital flow.
The Significance of the 0.5% Shift (Structural Breakdown): While recent weekly price swings might be larger, the modest, sustained increase in BTC.D is a strong signal of structural risk aversion. When BTC price is dropping, but BTC.D is rising, it means:
Altcoins are Declining Faster than Bitcoin: Altcoin holders are panic-selling into Bitcoin or, more likely, selling into stable coins /fiat, causing altcoins to lose market share relative to BTC.
Flight to Safety: Traders view Bitcoin as the least risky asset in the crypto space. They are consolidating their capital in BTC before exiting the market or waiting for a clearer picture.
This action confirms a broad-based, defensive, and sustained bearish environment, signaling that the entire market is under pressure—it’s a macro bearish sign, not just a localized BTC wobble.
The Pivot Point: A sustained hold above the 59.9% - 60.1% range suggests BTC is consolidating its market leadership. Should BTC.D break significantly higher (e.g., toward 60.5%), expect increased volatility and potential selling pressure across the altcoin sector as risk appetite completely vanishes.
RSI: The Bearish Confirmation (4H & 1D)
The Relative Strength Index (RSI) across both short and long timeframes is flagging confirmation of the bearish momentum.
Daily RSI: The daily RSI is trending lower and has recently broken below the neutral 50 level. This is a classic bearish signal, indicating that momentum has shifted from the bulls to the bears. A drop toward the 30-35 level is often needed to complete a significant corrective move and signal exhaustion.
4-Hour RSI: The 4H RSI is hovering near oversold territory (around 30-35), suggesting the current sell-off may be locally exhausted and due for a small bounce (a "dead cat bounce" or short covering). However, until the 4H RSI decisively reclaims the 50 level, the path of least resistance remains downward.
Wyckoff Distribution: The Current Cycle (1D Timeframe)
The price action since the recent high (near $114,000) aligns closely with a Wyckoff Distribution structure, suggesting a prolonged period of marking down is now underway.
Confirmation of Distribution: The break below the primary Support Line of the trading range (around $106,000) serves as a classic Sign of Weakness (SOW).
Actionable Phase: The current price action below $106,000 is likely the Mark-Down Phase. We should expect subsequent rallies to fail near previous support levels (now resistance) as institutional supply overwhelms demand.
Future Structure: Any rally back towards $104,000 - $106,000 would likely form a Last Point of Supply (LPSY)—an ideal short entry point—before the accelerated move to the final price targets.
Fibonacci Retracement and Extension Confluence
Key Resistance (Retracements)
Using the recent downswing from the high of $114,000 to the current area of support (approx. $101,400):
0.382 Retracement: $106,300. This aligns perfectly with the recent breakdown level, making it the most critical short-term resistance. A successful claim of this level is required to neutralize the immediate bear threat.
0.618 Retracement: $109,200. Reclaiming this level would be necessary to suggest the potential return of strong bullish momentum and a failed distribution structure.
Bearish Price Targets (Extensions)
Projecting the continuation of the current downside momentum:
1.00 Extension (Wave A=C or Target 1): $98,500. This is the high-probability target for the immediate downside move, aligning with key psychological support just under $100,000.
1.618 Extension (Wave 3 Target): $94,500 - $95,000. This level is the next major target if the $98,500 support fails, aligning with prior long-term accumulation zones.
Elliott Wave Structure: The Impulse Down (1D Timeframe)
The Daily chart suggests we are currently in an impulsive wave down, likely a Wave 3 of a larger corrective structure.
Confirmed Impulsive Move: The sharp decline from $114,000 confirms an impulsive move, likely labeled as Wave 1 of a larger A-B-C correction, or the start of a five-wave impulsive move down.
Current Wave: We appear to be in the middle of Wave 3 down, which is characteristically the longest and most destructive wave. This Wave 3 targets the 1.618 extension of Wave 1, aligning with the $94,500 - $95,000 area.
Roadmap: Following Wave 3, we would expect a corrective Wave 4 bounce (likely back toward $103,000 - $104,000) before the final decline in Wave 5 to the lowest targets.
Conclusion: Price Targets and Actionable Thesis
The technical roadmap for Bitcoin is bearish in the immediate term, driven by high-timeframe momentum breakdown and Wyckoff distribution characteristics.
🐻 Bearish Price Targets (Primary Focus)
The bearish thesis is active following the breach of the $106,000 structural support. Failure to reclaim the short-term resistance will confirm the path down.
Immediate Target: $98,500 (1.00 Fibonacci Extension & psychological support).
Mid-Term Target: $94,500 - $95,000 (1.618 Extension / Elliott Wave 3 target).
Extreme Target: $89,000 - $90,000 (Final Wave 5 target, aligning with a major long-term demand zone).
🎯 Bullish Price Targets (If Trend Reverses)
To neutralize the bearish threat, BTC must aggressively reclaim $106,300.
Neutralization Level (Invalidation): A daily close above $106,300 (0.382 Fib retracement).
Short-Term Target: $109,200 (0.618 Fib retracement / potential Wyckoff reversal point).
Ultimate Target: $114,000+ (Reclaiming this high would confirm a failed distribution and signal a full return to the bull trend).
