02/11/2025 POLYGON Article #63
सोचिए क्लास में attendance बोर्ड लगा हो और आप एक नज़र में जान लें कि कितने बच्चे रोज़ पढ़ने आ रहे हैं और कौन नियमितता से आगे बढ़ रहा है। Polygon POL नेटवर्क एनालिटिक्स के साथ मुझे भी यही clarity मिलती है। adoption data इतनी साफ़ और structured form में है कि ecosystem की pulse तुरंत समझ में आ जाती है। Web3 में जहां narrative तेजी से बदलते हैं, वहां real-time adoption data सबसे बड़ा सच होता है। Polygon POL इसी सच को numbers और smart visualization के माध्यम से सामने रख रहा है।
Value Proposition: डेटा जो निर्णय लेने लायक हो
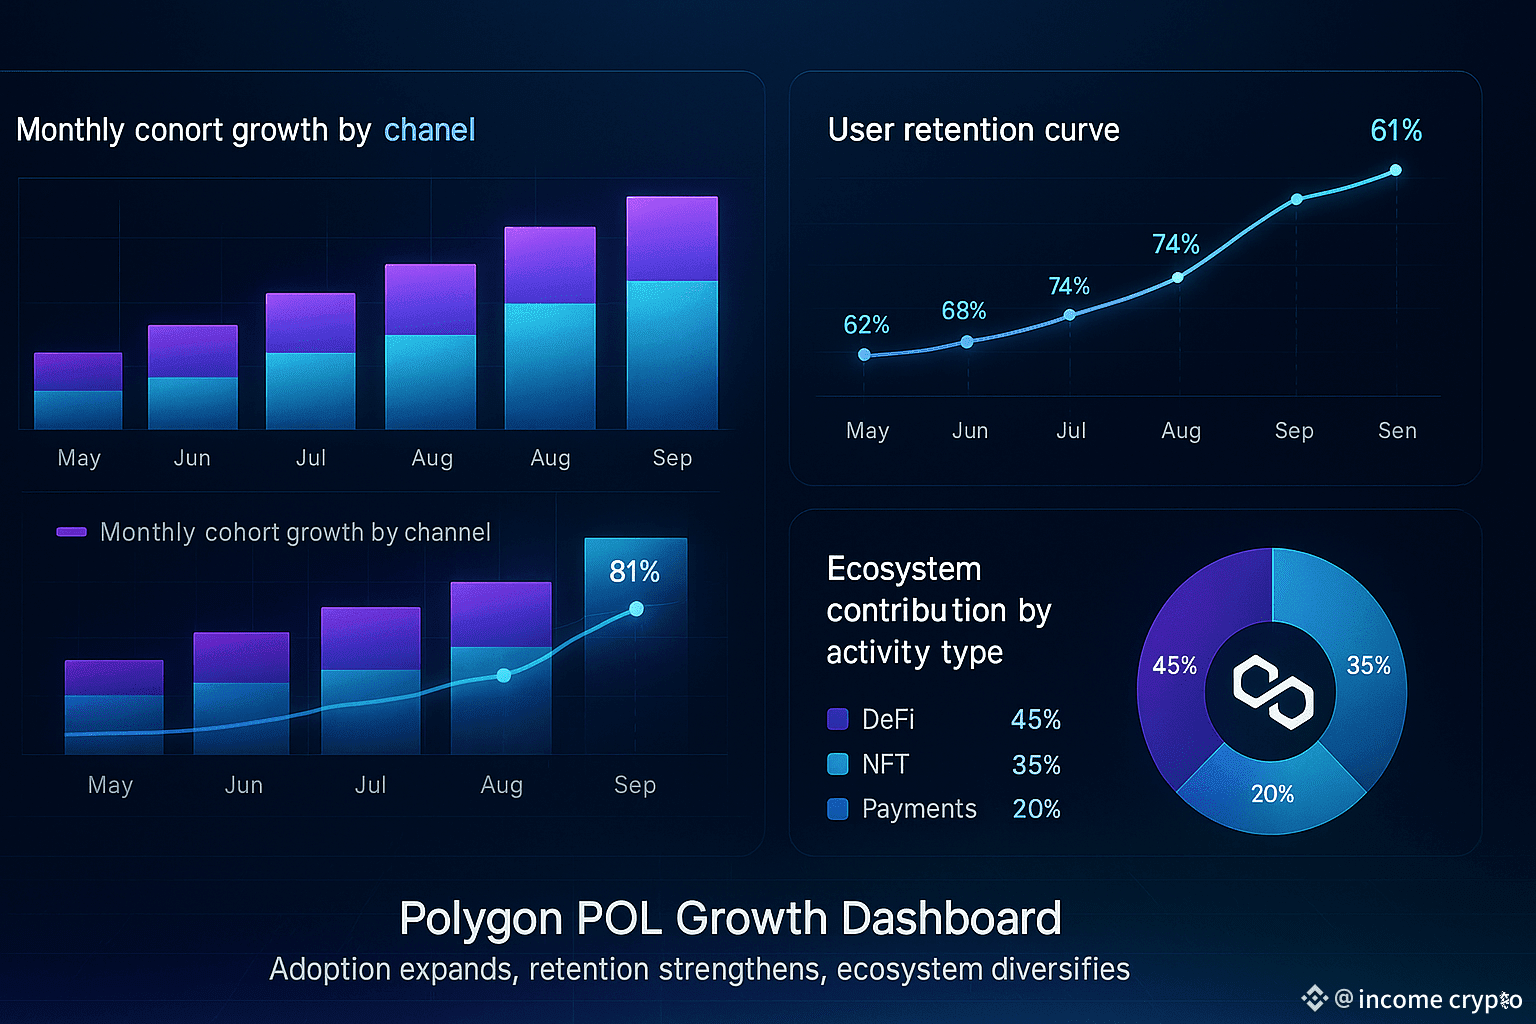
अच्छे डेटा की परिभाषा वही है जो आपको सोचने में समय न लगाए बल्कि निर्णय लेने में मदद करे। Polygon $POL का network analytics मॉडल adoption को सिर्फ count नहीं करता, बल्कि उसे human-understandable visual form में प्रस्तुत करता है। यह approach plain charts से आगे जाता है और cohort-based view देता है, जिसमें पता चलता है कि कौन से users लंबे समय तक ecosystem में बने हुए हैं, कौन से segments accelerate हो रहे हैं और network retention pattern कैसा है। इसे ऐसे समझिए कि देखने भर से समझ आ जाए कि किस प्लान का उपयोग कौन कर रहा है और adoption का असली narrative कहाँ से आ रहा है।
ताज़ा अपडेट: नया dashboard और granular मॉडल
हालिया @Polygon POL अपडेट में नया metrics dashboard live हुआ है। इस संस्करण में multi-chart cohort visualization, detailed retention curves और clearly defined metrics dictionary शामिल हैं। governance feedback के बाद dashboard को public and granular बनाया गया ताकि community और analysts दोनों data को independently explore कर सकें। यह सिर्फ cosmetic upgrade नहीं है, यह ecosystem-level transparency और data-driven culture की ओर एक कदम है। मैंने इसे जैसे ही देखा, community newsletter में discuss किया और engagement में noticeable jump आया। यह संकेत है कि developers और long-term investors इस तरह के analytics को serious signal मानते हैं।
क्यों मायने रखता है: Trader और Investor की नजर से
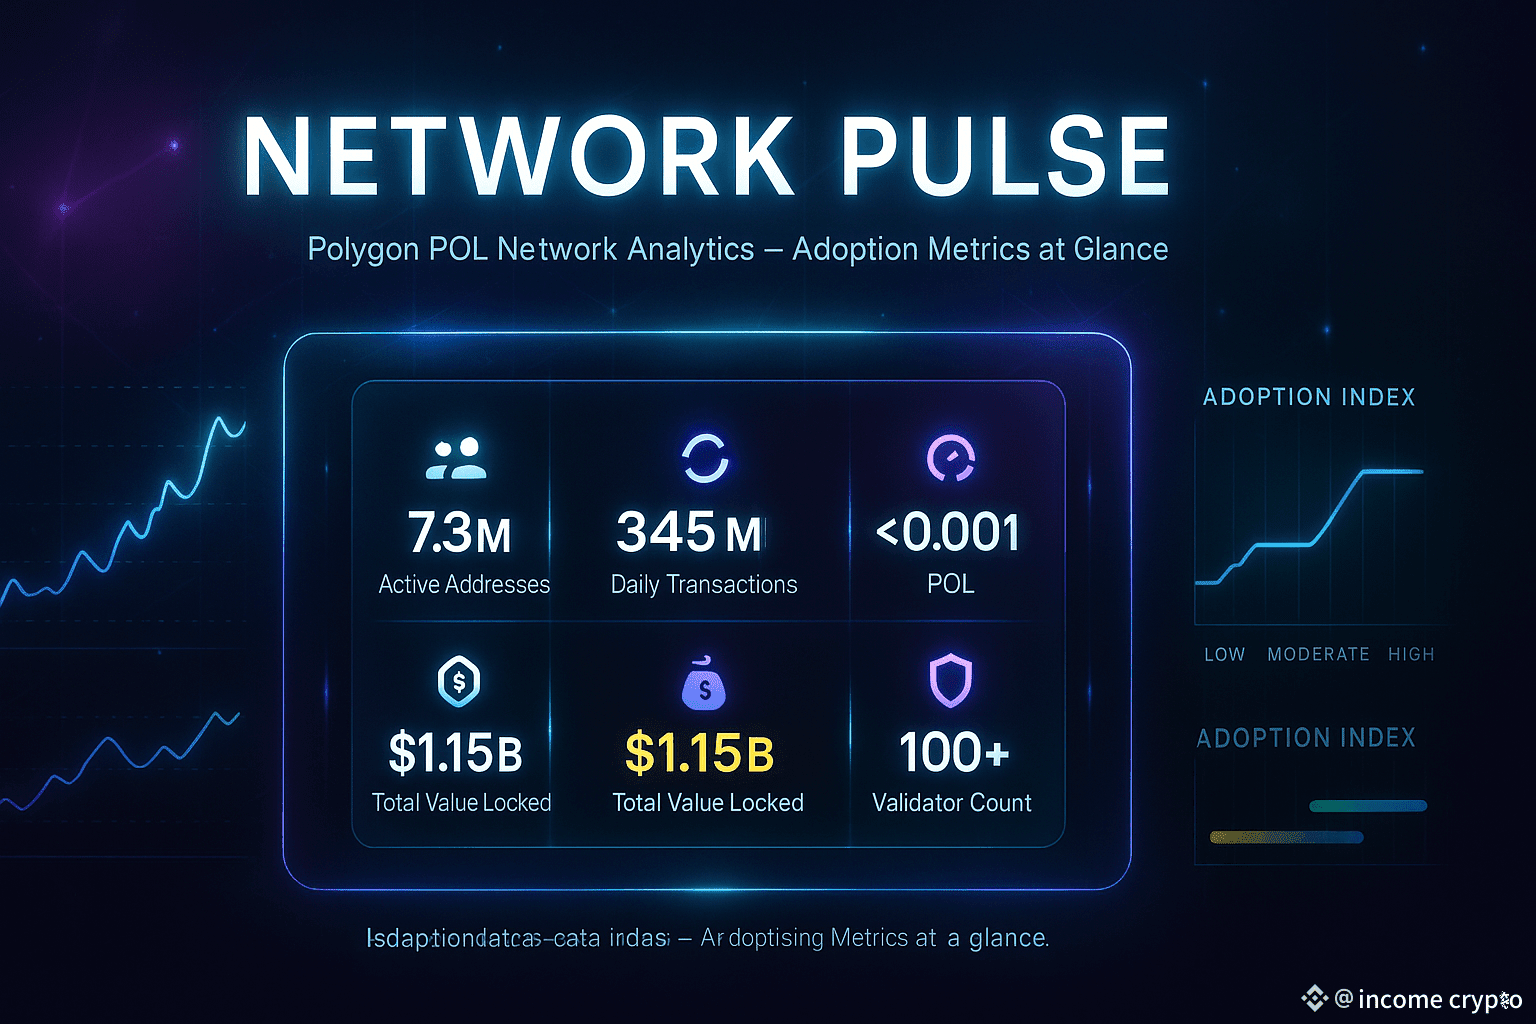
Raw numbers हर जगह मिल जाते हैं, लेकिन adoption का meaning trends और retention में होता है। जब user cohorts में consistency दिखती है, transaction clusters stable रहते हैं और active addresses का slope ऊपर की ओर होता है, तो यह sustainable demand का संकेत होता है। इसे शहर की population pyramid की तरह समझिए। अगर युवा और सक्रिय वर्ग का प्रतिशत बढ़ रहा है, तो शहर में energy, consumption और economic growth का chance अधिक होता है। उसी प्रकार Polygon POL token की long-term utility और network positioning तब मजबूत लगती है जब data real usage दिखाता है और builder economy steady grow कर रही होती है। institutional readers अक्सर यही ढूंढते हैं कि network hype पर नहीं बल्कि usage पर टिके।
Tokenomics और Key Metrics: संकेत और व्याख्या
Polygon POL analytics framework में active addresses, daily transaction flow, staking participation और treasury allocation signals को एक साथ देखा जाता है। यह holistic view देता है कि network health कैसी है और value flow किन pockets में जा रहा है। supply shifts और wallet movement patterns भी track होते हैं ताकि token liquidity और circulation dynamics समझ आए। staking cohorts retention chart बताते हैं कि लंबी अवधि तक ecosystem के साथ जुड़े users कितने committed हैं। builder rewards और grant flows time-series में दिखते हैं, जिनसे clear होता है कि ecosystem funds कहाँ deploy हो रहे हैं और उनका impact क्या है। यह data narrative को grounded बनाता है।
Community Energy और Regional Indicators
Polygon POL community data-driven culture को गंभीरता से ले रही है। analytics dictionary और data cadence को लेकर चर्चा बढ़ रही है, regional feedback cycle active है और builders insights पर open dialogue करते हैं। कुछ emerging regions में adoption curve तेज है और उस traction के साथ organic growth proof मिल रहा है। यह Web3 ecosystems में maturity का संकेत है, जहां community सिर्फ slogans से नहीं बल्कि signal-based reasoning से value समझती है।
Gov/Dev Task: Metrics Dictionary और Standards
एक मजबूत analytics system का आधार है definitions की clarity। Polygon POL governance layer में metrics dictionary और reporting cadence standardize करने पर काम हो रहा है। definitions, sampling logic और verification proofs की clarity analyst और institutional users दोनों को confidence देती है। यह framework सिर्फ internal view नहीं बल्कि externally credible structure बनाता है और ecosystem को information-first discipline देता है।
भविष्य का रूप: Smart Alerts और Research Syndication
भविष्य में Polygon POL analytics में payments-specific cohorts, AI-based anomaly alerts और behavior-linked retention logic देखने को मिल सकता है। identity-enabled cohorts और compliance aware dashboards enterprise adoption को और smooth बनाएंगे। research partners और community analysts के साथ co-distribution adoption narrative को amplify करेगा। ecosystem की growth pace data-backed approach से और स्पष्ट होगी।
निष्कर्ष
डेटा तब meaningful होता है जब वह साफ, accessible और actionable हो। Polygon POL का analytics architecture बेहद transparent और practical है, जो network adoption को जनसंख्या चार्ट की तरह पढ़ने लायक बना देता है। मेरा मानना है कि यह insight-first vision ecosystem और POL token दोनों के लिए positive structure तैयार कर रहा है। अब सवाल यह है: क्या आपको लगता है कि Polygon POL इस bull cycle में hidden adoption gem साबित होगा? अपनी राय साझा करें और बताएं कि आप कौन से metric को सबसे ज्यादा महत्व देते हैं।
ये प्रोजेक्ट के बारे में और जानकारी के लिए जुड़े रहें IncomeCrypto के साथ।