
Key Takeaways
BNB price climbs 2.51% to briefly break $1,180, outpacing the broader crypto market’s 1.35% gain
$1.69B token burn marks BNB’s largest quarterly burn, reducing supply to 137.74M BNB
Regulatory optimism surges after founder and former CEO CZ’s presidential pardon
BNB Price Action and Market Context
BNB price advanced to $1,166.3 USD, rising 2.51% in 24 hours, with intraday highs reaching $1,173.36. This move follows a rebound above the $1,150 resistance level, signaling renewed buying pressure across Binance’s native asset. The rally outperformed the broader crypto market, which posted a more modest 1.35% daily gain.
The upward trend coincides with the completion of BNB’s 33rd quarterly token burn, which destroyed 1.44 million BNB (valued at $1.69 billion)—the largest in USD terms to date.
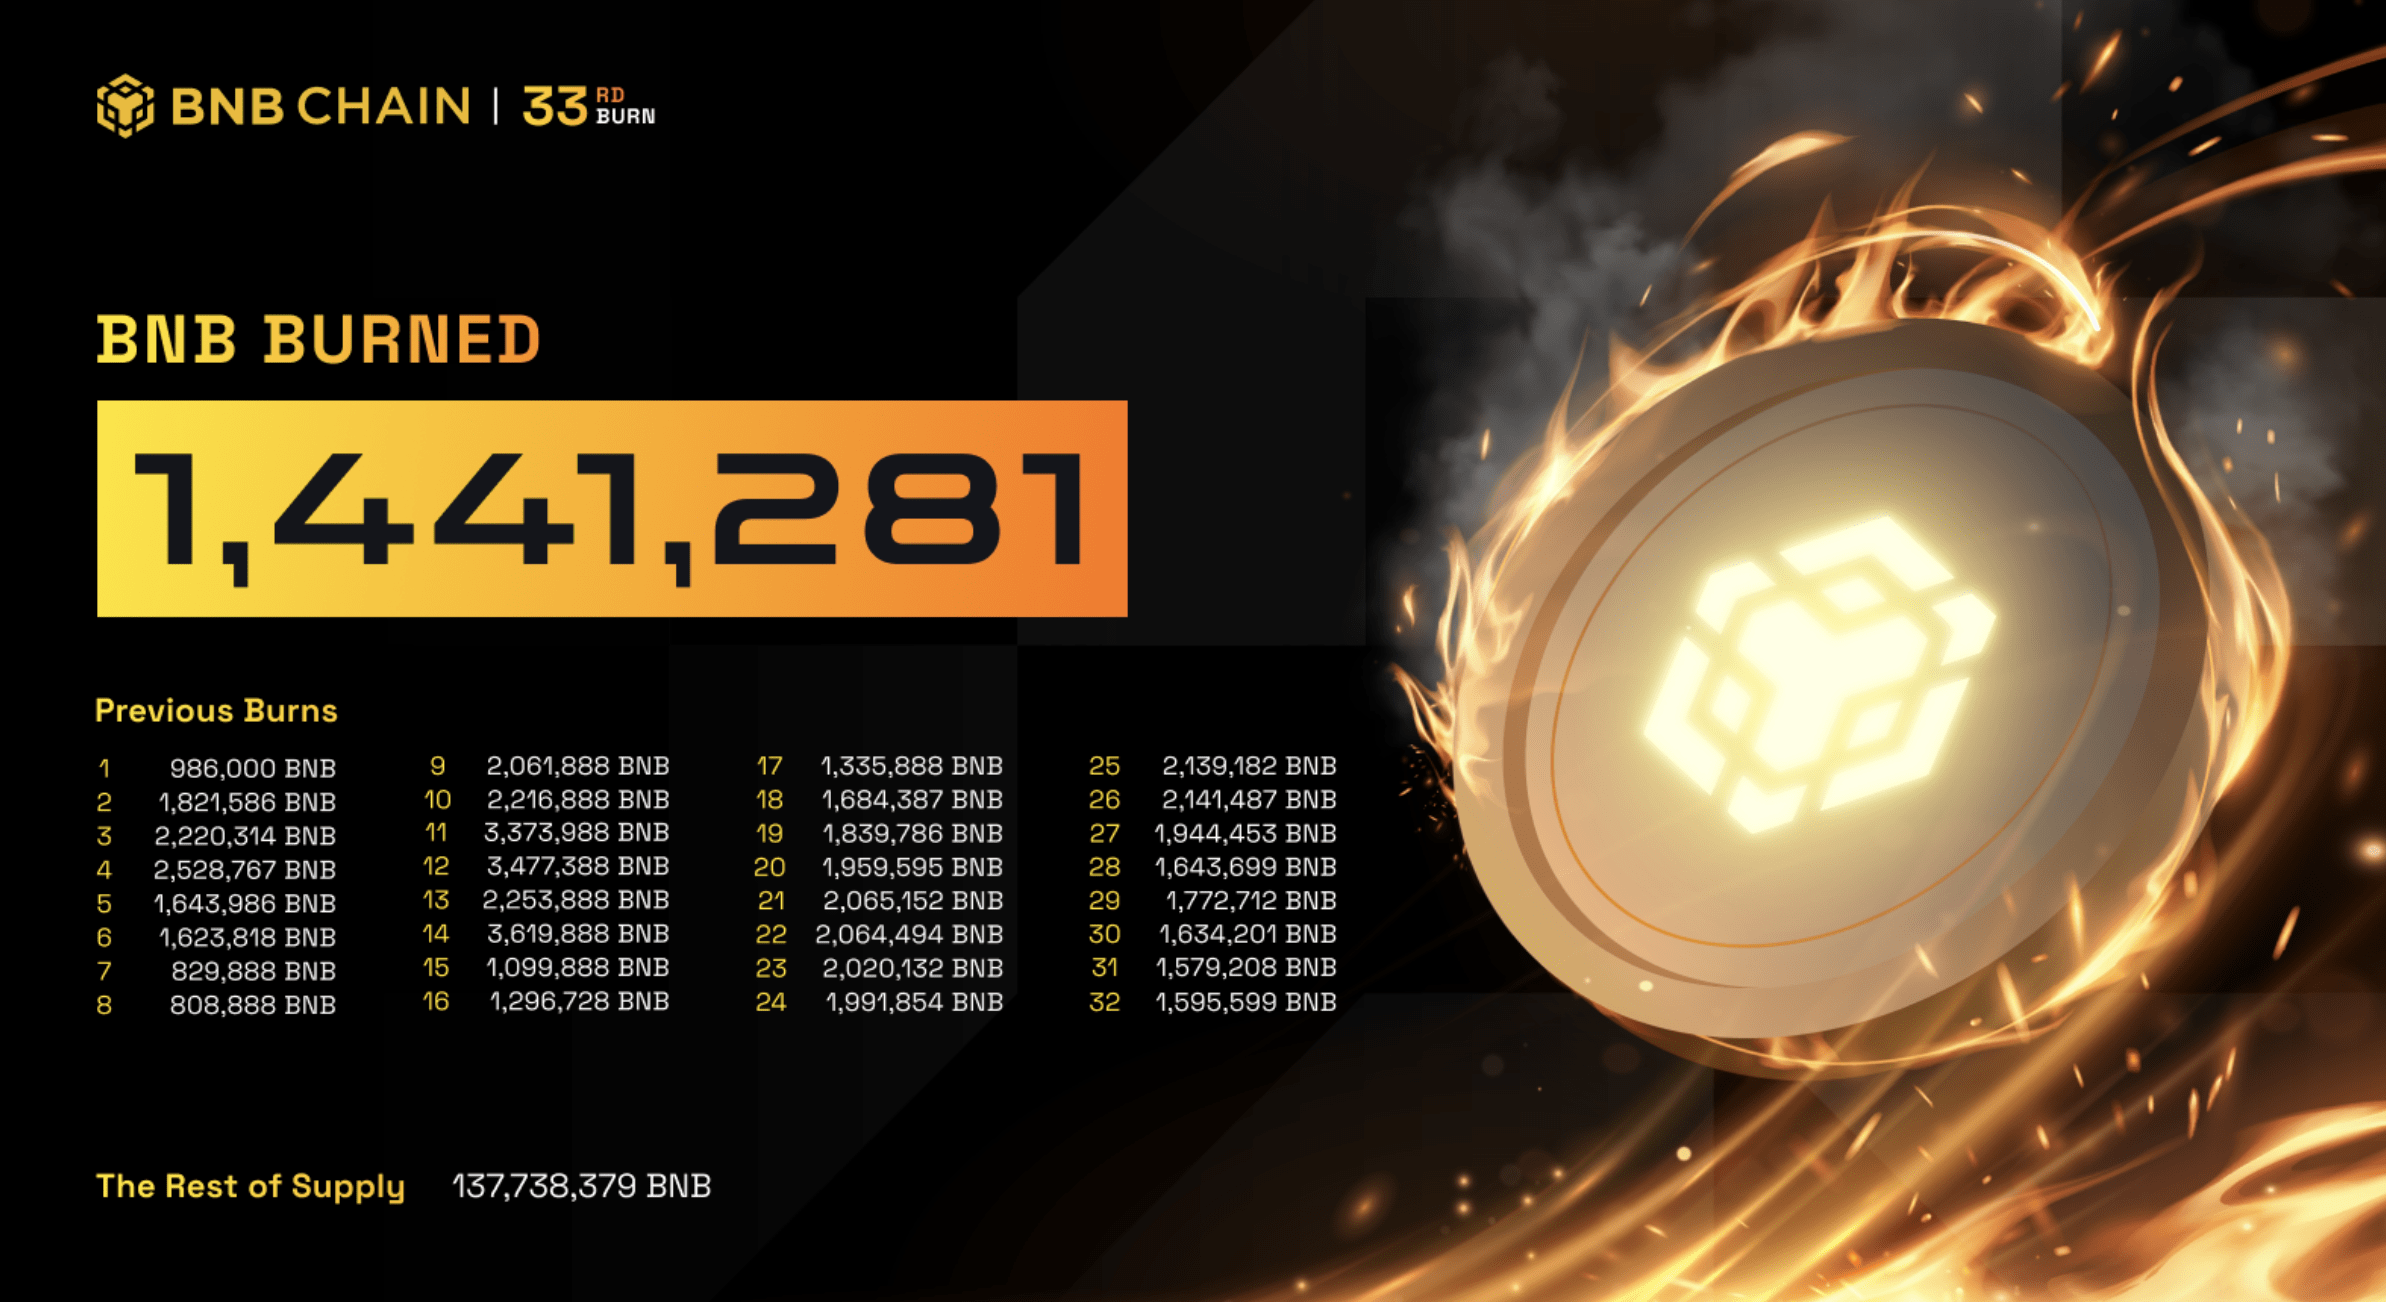
The event reduced circulating supply to 137.74 million tokens, reinforcing BNB’s deflationary mechanics and strengthening its scarcity-driven value proposition.
Deflationary Burn Strengthens Bullish Momentum
BNB’s auto-burn mechanism continues to be a key driver of long-term value creation. With the BNB Chain ecosystem expanding to 5,600+ dApps and holding $3.6B in total value locked (TVL), the reduced supply magnifies upside potential during periods of increased demand.
The next scheduled burn in January 2026 will depend on Q4 transaction volumes, which serve as the primary input for the burn formula. Investors are closely monitoring on-chain activity and network growth metrics for early signals of continued low-supply dynamics.
Regulatory Optimism and Market Sentiment
A major catalyst behind the recent surge was news of founder and former CEO Changpeng Zhao’s (CZ) pardon from US President Trump, which broke late last week, and reignited market confidence and removed a lingering regulatory overhang. Analysts view the reduced legal uncertainty as a positive step toward restoring institutional interest in the exchange’s broader ecosystem.
Technical Indicators Show Improvement
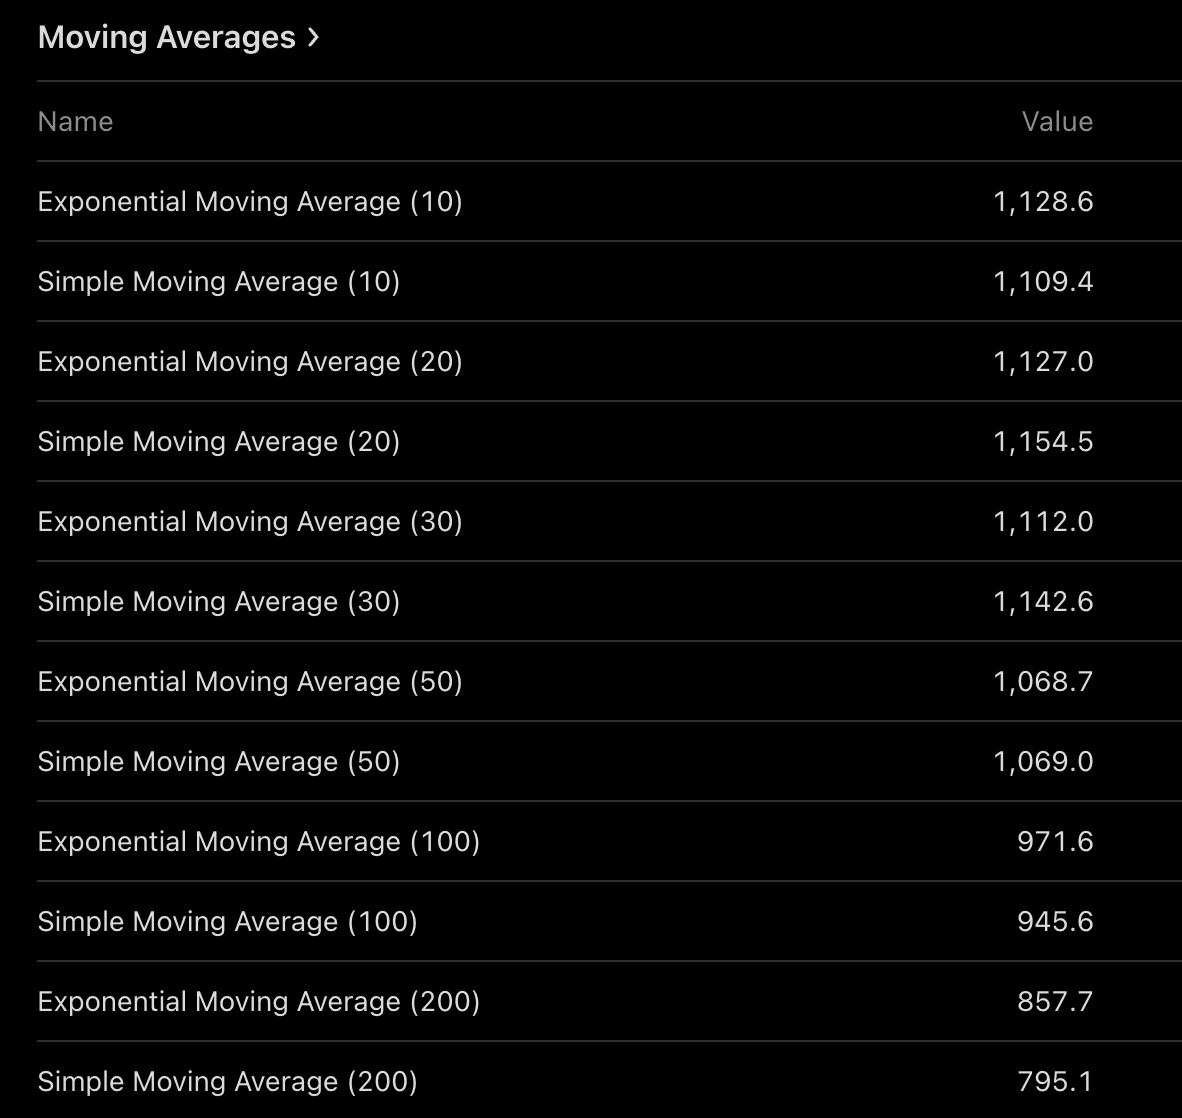
From a technical standpoint, BNB’s breakout above $1,150 is supported by a Relative Strength Index (RSI 14) reading of 55.3, reflecting moderate bullish momentum without signaling overbought conditions. On the moving averages front, all short- to long-term exponential and simple averages (10–200 periods) remain above current price levels, suggesting consistent upward trend structure. The 50-day EMA at $1,068.7 and 100-day SMA at $945.6 act as layered support zones, while the 200-day SMA at $795.1 anchors the longer-term uptrend.
However, resistance remains near the $1,185 level (38.2% Fibonacci) and $1,370 (October high), where profit-taking pressure may reemerge if momentum stalls.
Outlook for BNB: Price Levels to Watch
Considering current technical indicators, the $1,160–$1,185 range now serves as a critical price zone to determine whether market confidence sustains above key resistance levels.
Traders should track Bitcoin’s correlation (BTC up 3.05%) for potential cross-market influence, as well as any signals of institutional inflows into BNB-related products or staking platforms.