

Bollinger Bands compression on Hyperliquid indicates mounting pressure and a likely spike in volatility in the coming sessions.
HYPE trades around $47.39 with $15.82B market cap, supported by resilient buying after holding near $46.00 support.
Traders watch $52 resistance on the upside and $38–$40 support on the downside for the next directional breakout.
Hyperliquid ($HYPE) is showing signs of mounting pressure as a Bollinger Bands squeeze develops on the daily chart. The pattern suggests that volatility may soon expand, with traders preparing for a decisive directional move.
Bollinger Bands Squeeze and Market Setup
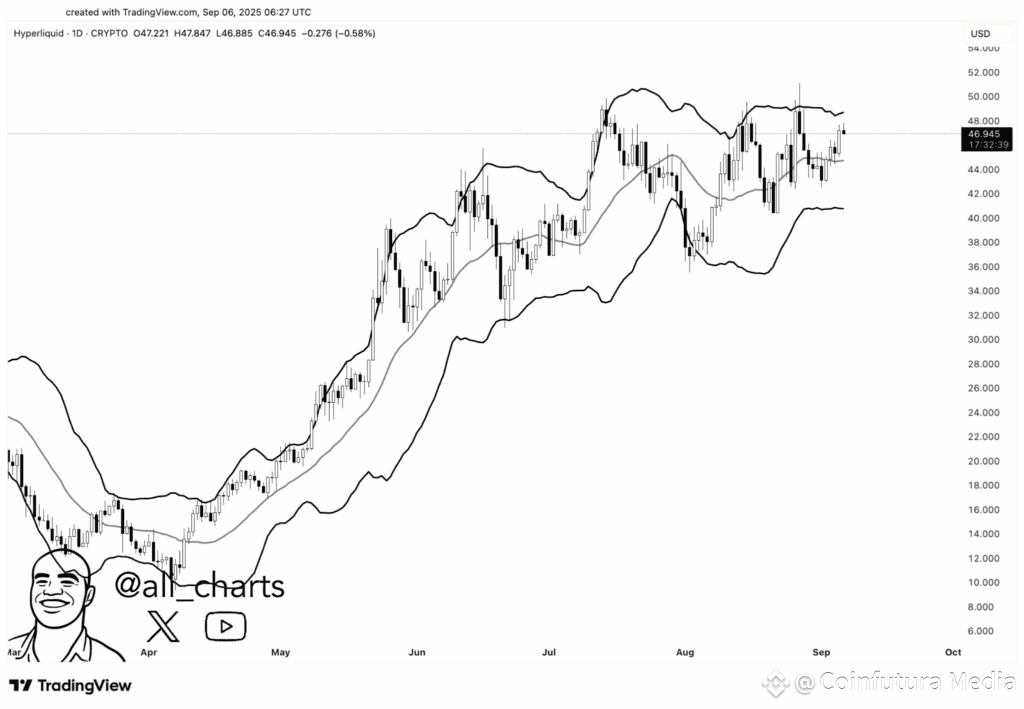
Ali (@ali_charts) noted that Hyperliquid is currently experiencing a classic Bollinger Bands squeeze on its daily timeframe. The narrowing of the bands reflects suppressed volatility, a condition often followed by sudden and sharp market expansions. Historical precedents in June, July, and August revealed that similar squeezes led to extended multi-week directional moves.
 Source: ali_charts via X
Price action is currently situated near the upper-mid region of the bands, consolidating in the mid-$40s range. The midline moving average has repeatedly provided dynamic support during recent pullbacks, helping stabilize price action despite market fluctuations. These technical factors align with the setup of potential breakout conditions.
The squeeze itself is not directional, but it indicates volatility is about to spread. The traders are keenly watching whether price will close decisively above the upper band, which will indicate continuation in the direction of the bulls provided the volume supports this.
Price Action and Market Structure
Hyperliquid is as of writing, trading at $47.39, reflecting a 1.34% gain in the last 24 hours. Intraday recovery from lows near $45.49 underscores renewed buying interest, with traders stepping in to absorb pressure. This resilience points to $46.00 establishing itself as near-term support.
Market capitalization stands at $15.82 billion, while fully diluted valuation reaches $47.39 billion, aligning with the circulating token price. With 333.92 million tokens in circulation from a total supply of 1 billion, nearly one-third of supply is already tradable. This controlled distribution provides a clear view of liquidity conditions.
The volume of trading has however improved with the last day seeing $129.15 million being traded, a reduction of 14.6% ahead of the previous day. The ratio of volume to market cap is $0.8163 that maintains the liquidity but low market participation as compared to previous sessions.
Breakout Scenarios and Key Levels
Positively, traders are awaiting a continuation of the above previous highs around 52 which are the upper band. If confirmed with rising volume, further targets may align with measured projections from the band width and past swing highs.
Conversely, a failure to hold recent gains could pressure HYPE toward $45.00, with stronger downside support between $38 and $40. This zone has historically absorbed selling pressure and may act as a defensive level if bearish momentum takes hold.
Volume behavior will play a central role in filtering genuine moves from false signals. Expansions supported by increased volume and open interest offer greater reliability, while breakouts lacking confirmation often reverse quickly. Traders are therefore urged to monitor market conditions closely and adapt positions accordingly.
