

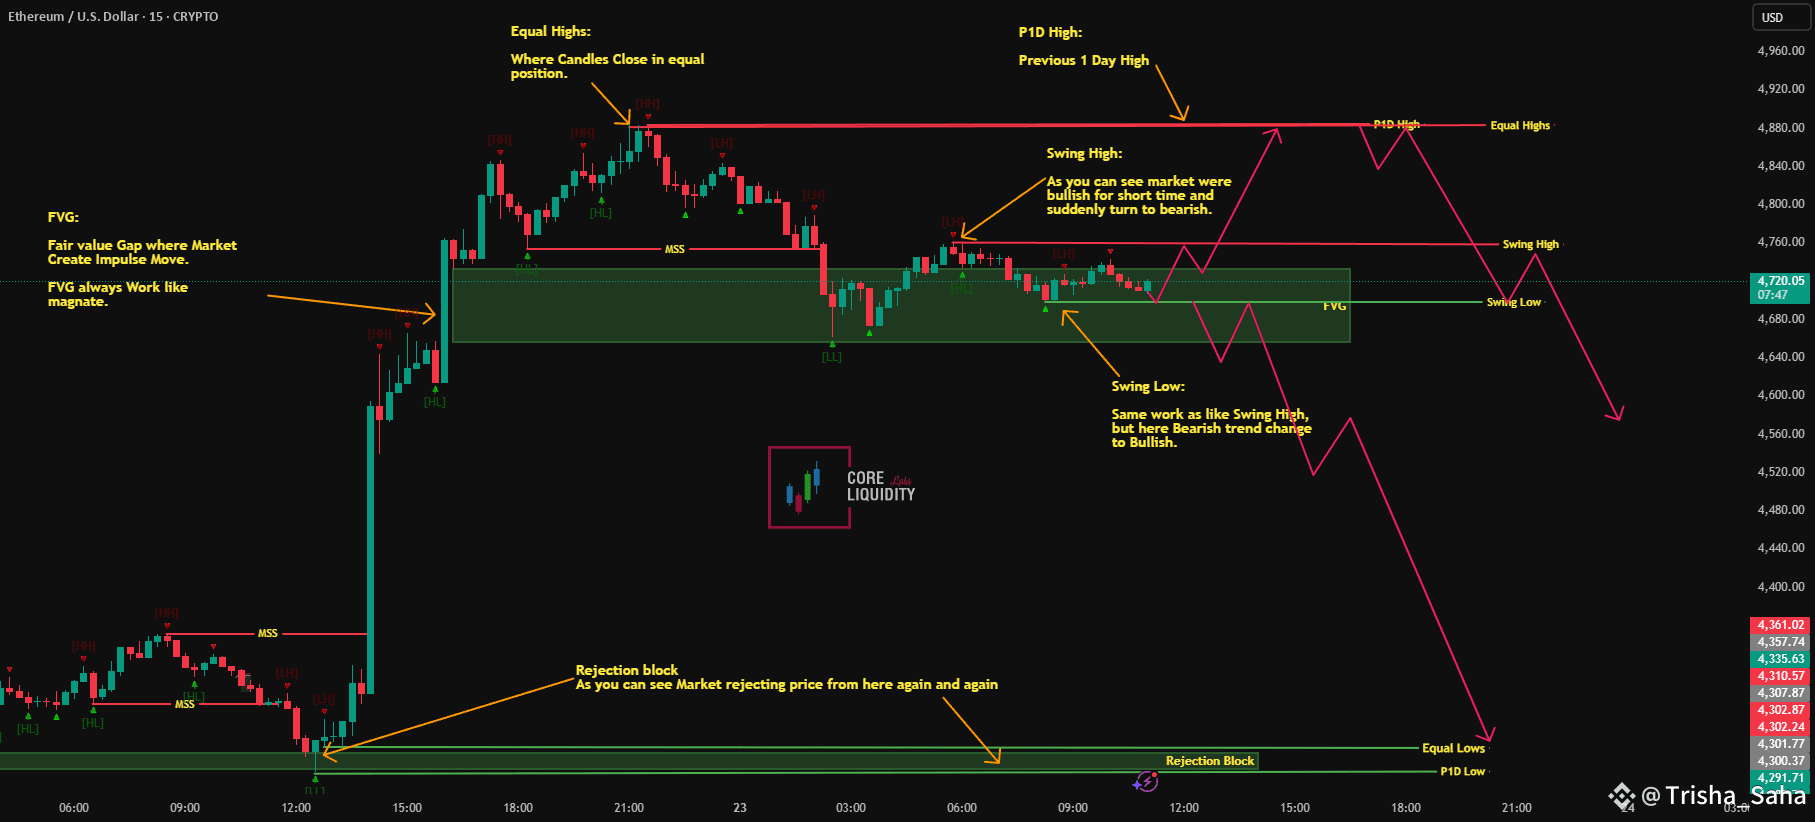
This chart highlights how market structure and liquidity zones interact, giving both trading opportunities and educational insights.
📌 Key Concepts on Chart
* FVG (Fair Value Gap): Acts like a magnet where price often returns to balance.
* Equal Highs: When candles close at the same level — liquidity builds here.
* Swing High: Short-term bullish momentum suddenly shifting bearish.
* Swing Low: Opposite of swing high — bearish momentum shifting bullish.
* Rejection Block: Zone where price rejects repeatedly, confirming strong demand or supply.
* P1D High / Low: Previous day’s high and low, important liquidity points.
📈 Bullish Idea
* Hold above swing low / rejection block
* Push into equal highs & P1D high
* Continuation possible toward liquidity above.
📉 Bearish Idea
* Failure at equal highs / P1D high
* Drop back through swing low
* Possible continuation toward equal lows / P1D low.
💡 Educational Note:
Market structure flows from Break of Structure → Retracement → Trade from POI (Point of Interest).
Patience to wait for liquidity zones is key.