
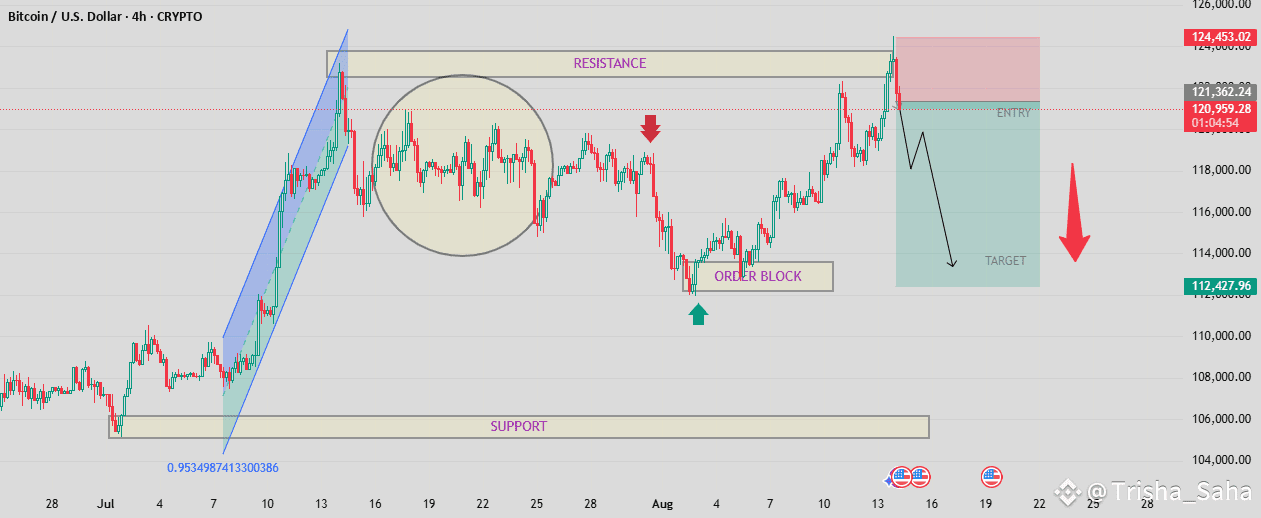
Price broke out of the channel to the upside, moved higher, and then started consolidating (circled area).
After consolidation, price dropped sharply, approaching a lower zone.
---
2. Key Levels Marked
Support: Horizontal purple label at the bottom, indicating a strong demand zone from the past.
Resistance: Horizontal purple label above, marking where sellers are likely to step in.
Order Block: A labeled zone between support and resistance — potential reversal area from institutional buying/selling activity.
---
3. Trade Setup
There’s a long trade plan visible using the long position tool:
Entry Zone: Green shaded area at the lower level.
Stop Loss: Red shaded area below the entry.
Target: Marked above the entry zone, aiming for a bounce toward higher levels.
The plan suggests entering after price taps into the lower support/order block, with a bullish expectation.
---
4. Current Price & Timeframe Context
Price at the time of screenshot is around $121,191 (note: this value seems unusually high for BTC — likely due to custom scaling or an experimental index, since normal BTC/USD is far lower).
Timeframe covers late July through August 2023.
---
5. Market Structure Insight
The setup appears to be a countertrend trade — buying after a significant drop, expecting a retracement.
The circled consolidation suggests indecision before the drop, which could act as supply/resistance if price retraces.
#BNBBreaksATH #BTCBreaksATH #ETHRally #REVABinanceTGE #ETH5kNext?