
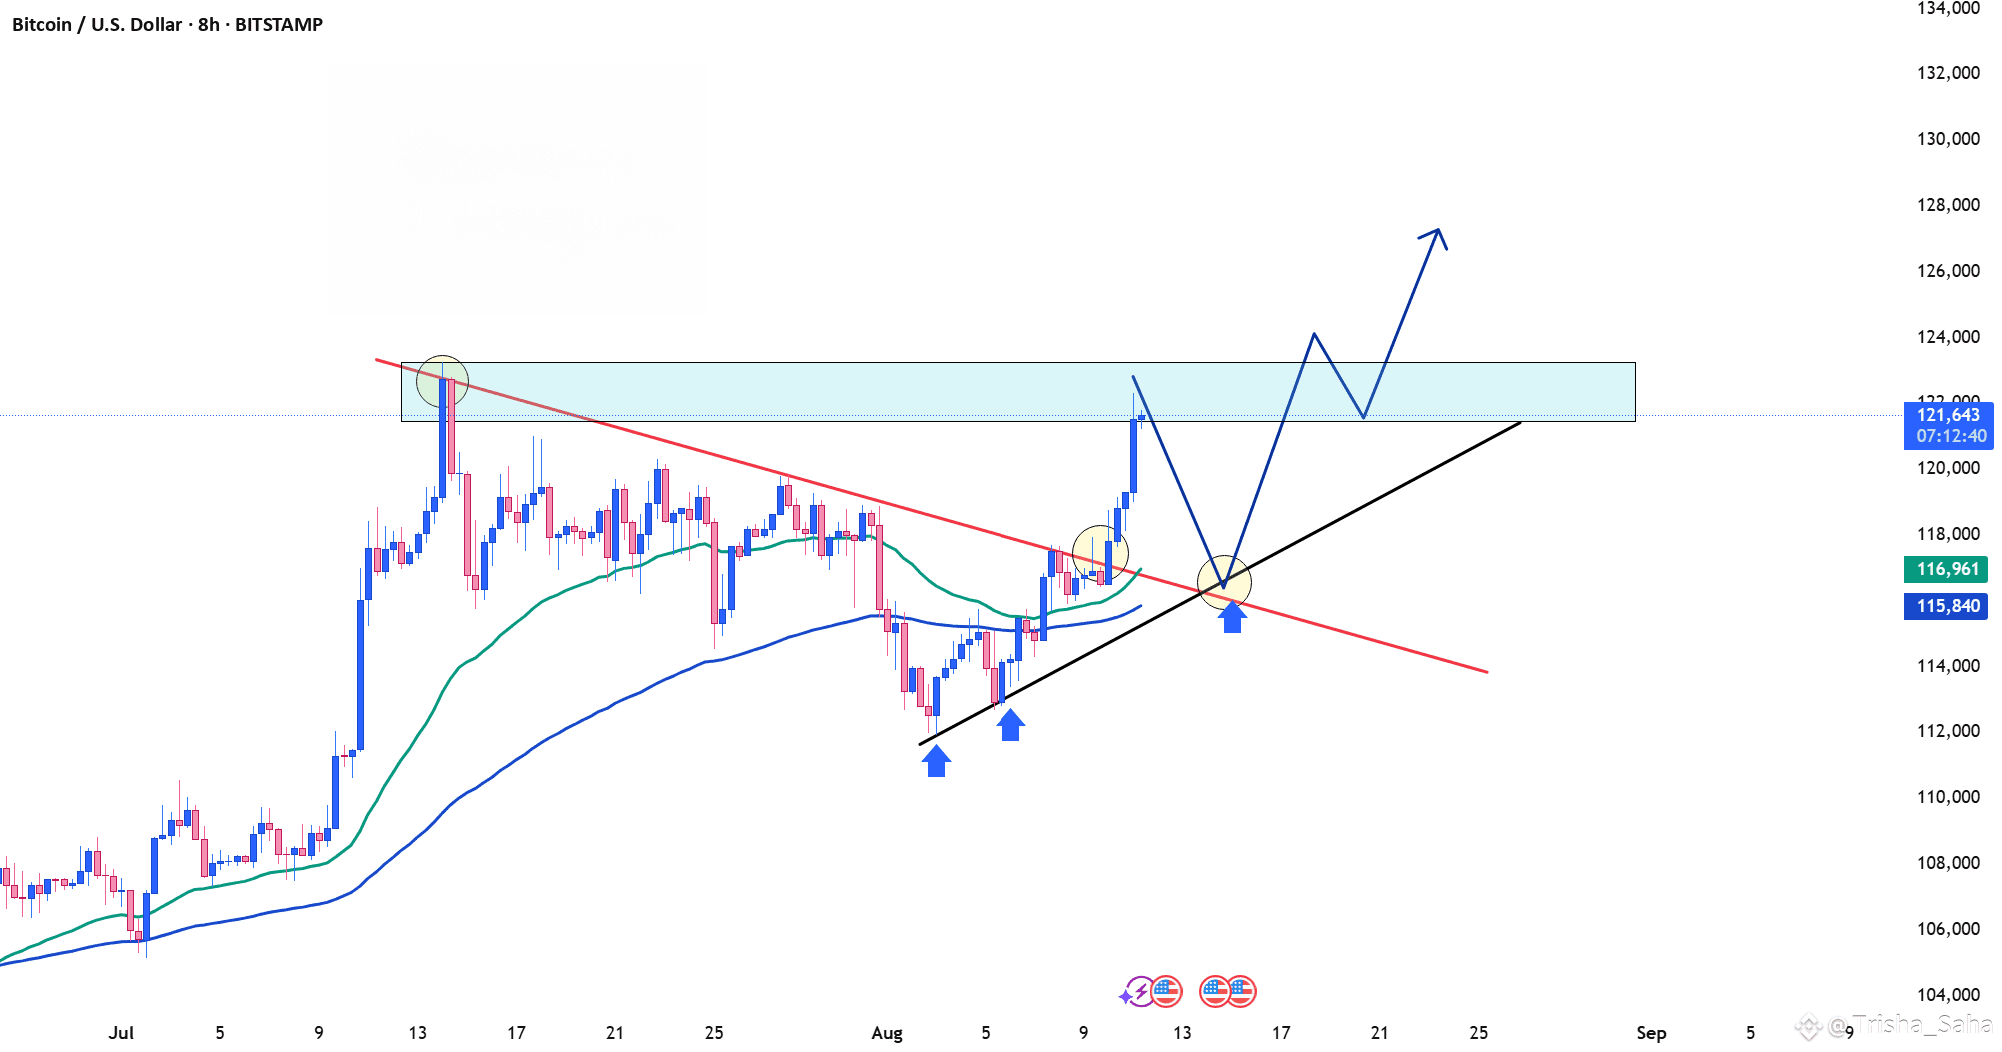
Looking at Bitcoin (BTC/USD) on the 8-hour chart, we’re witnessing some exciting action as BTC edges closer to a critical resistance zone, just below $122,000. This level has previously seen rejection, but the bulls are making a strong push with increasing momentum.
Key Levels to Watch:
Resistance Zone: $121,500 - $122,000 (previous rejection area)
Support Trendline: The strong black diagonal line, providing solid support since mid-July.
What’s Happening Now?
Bitcoin has just broken above the crucial trendline, suggesting a possible continuation of the bullish momentum.
The price action around the $121,500 zone is crucial: a clean breakout above this level could trigger a surge towards $124,000 and beyond.
What’s Next?
If BTC breaks and closes above the $122,000 level, we can expect a continuation towards new highs.
Watch out for potential pullbacks to the trendline for a retest before jumping in for long positions.
Trading Strategy:
Look for a breakout confirmation above $122,000, with potential targets at $124,000 and even $130,000 in the longer term.
Stop-loss should be placed just below the trendline support ($116,500) to manage risk efficiently.
Key Takeaway: Bitcoin is gearing up for a potential breakout, but patience is key! Let’s keep an eye on the market as we approach that critical resistance zone.
💬 What’s your take on Bitcoin's next move? Will it break the resistance, or is this just another fakeout? Drop your thoughts in the comments below!
#BTCReclaims120K #ETH4500Next? #BinanceAlphaAlert #USFedNewChair #USFedBTCReserve