

Overview: Critical Price Action at Key Confluence Levels
@The Notcoin Official the native token for a Telegram-based mini-game, is currently testing a critical support zone formed by an ascending trendline and a horizontal price level. The convergence of these technical factors often signals the potential for a price reversal, and the current price action reflects this possibility. As the market approaches this pivotal point, both bulls and bears are positioning for a decisive move, making this a crucial moment for traders.
Price Action and Trading Volume: A Mixed Outlook
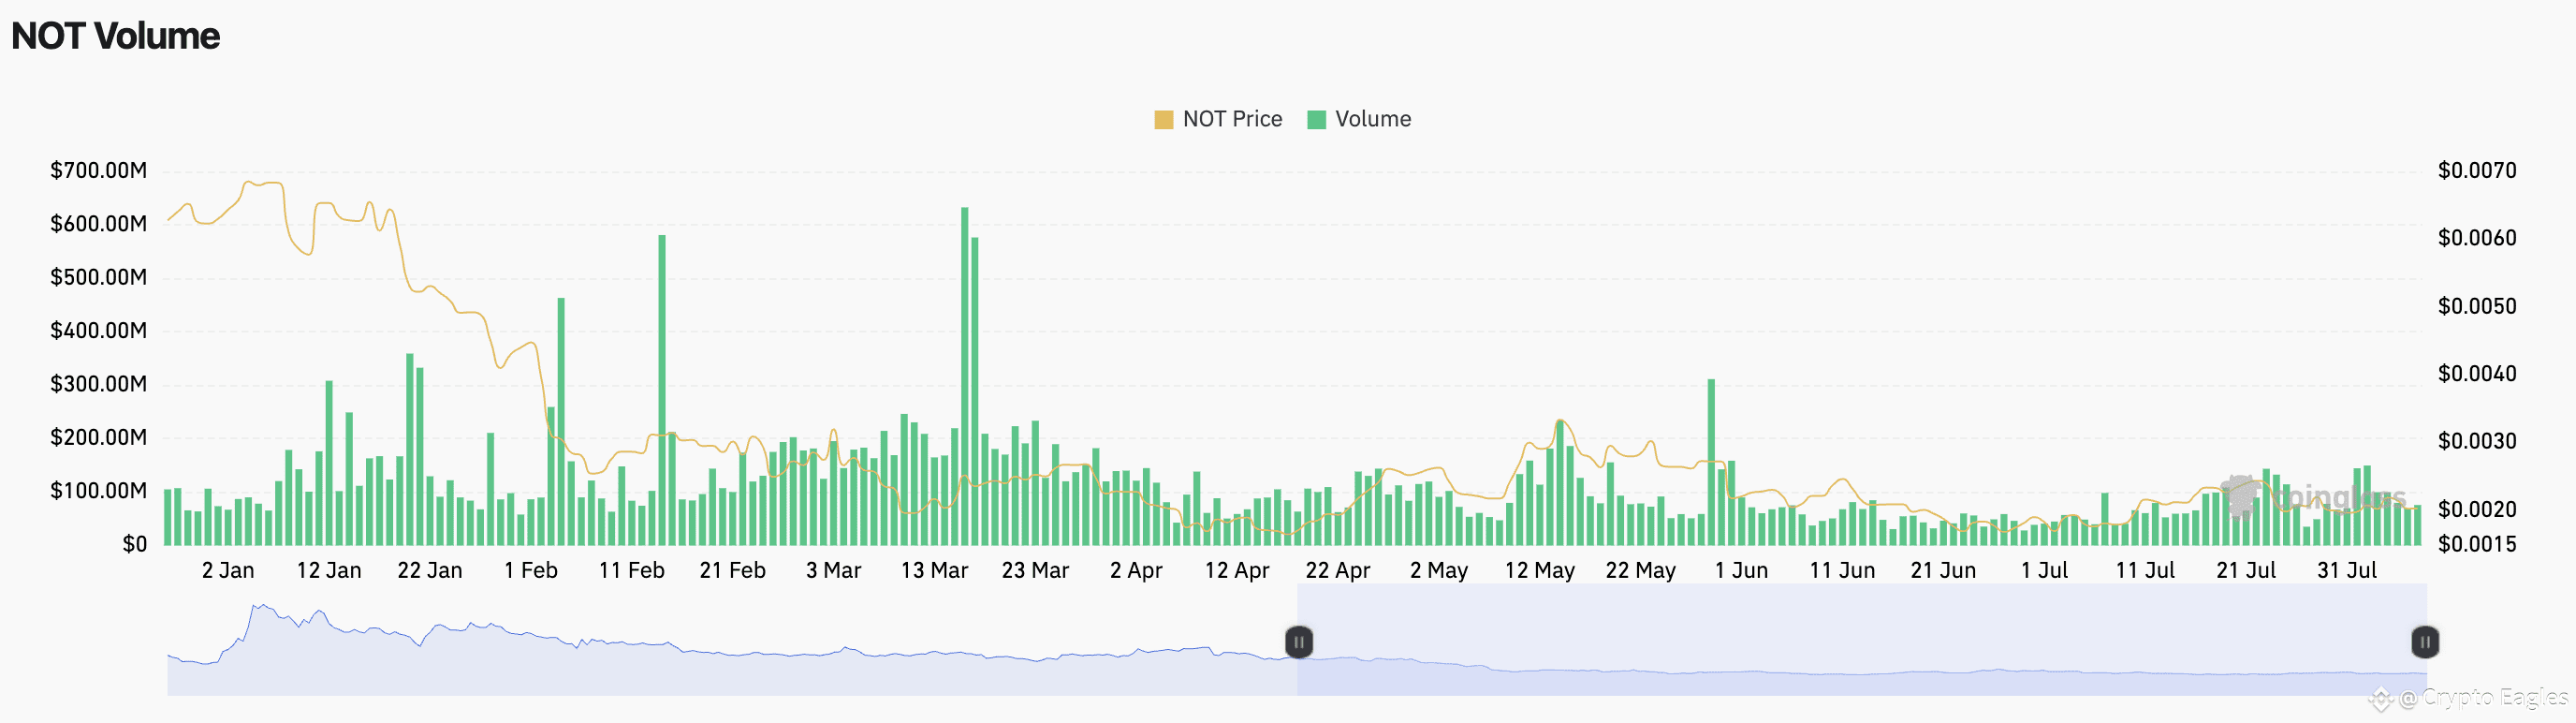
At the time of writing, $NOT is trading around $0.0020, down 5.2% from the previous day’s close. This decrease follows a series of three consecutive red candles, indicating some short-term bearish pressure. Despite this, the token has seen an uptick in trading volume, rising by 17% over the last 24 hours. The surge in volume is a positive indicator, suggesting that interest in NOT is increasing, even as prices drop. Such behavior is often a sign of accumulation, as investors take advantage of lower prices to enter or increase their positions.
Market Sentiment: Accumulation Amid Price Weakness
Although the price continues to trend downward, the broader market sentiment is split. According to data from CoinGlass, $NOT experienced an outflow of $278K as of August 5th, signaling that a significant number of tokens are being moved off exchanges. This movement is often interpreted as accumulation, which can reduce selling pressure and offer support for the price in the longer term. The increased trading volume and reduced sell pressure suggest that NOT may be poised for a potential reversal if the sentiment shifts in favor of the bulls.
Key Levels and Liquidation Zones: A Test of Market Sentiment
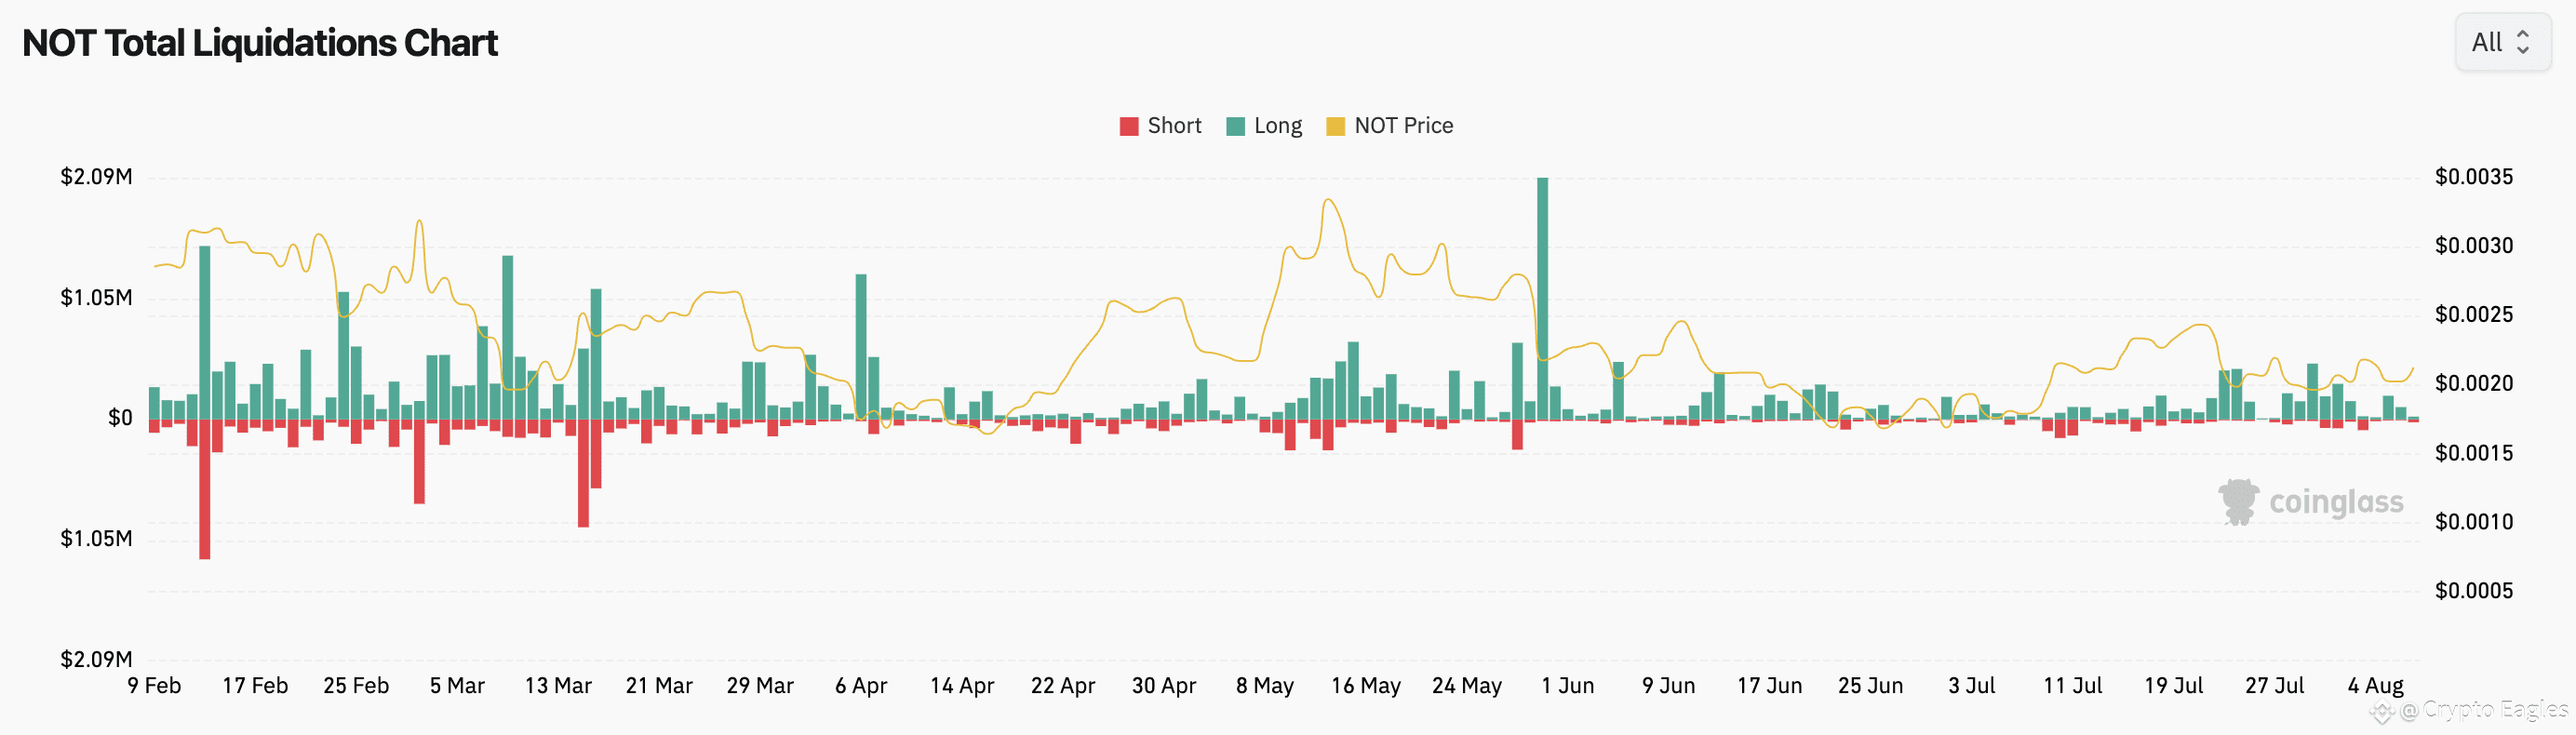
Traders are closely watching two key levels: $0.00193 on the downside and $0.00206 on the upside. These levels are particularly important because they represent significant liquidation zones, with large open positions at both levels.
If the price drops to $0.00193, nearly $494.5K worth of long positions will be liquidated, which could intensify selling pressure.
Conversely, a rise to $0.00206 would lead to the liquidation of approximately $1.17 million worth of short positions, providing a potential catalyst for a price rebound.
This divergence in liquidation zones highlights the split sentiment in the market, with bearish pressure still dominating but the possibility of a bullish shift should the price rise beyond key resistance levels.
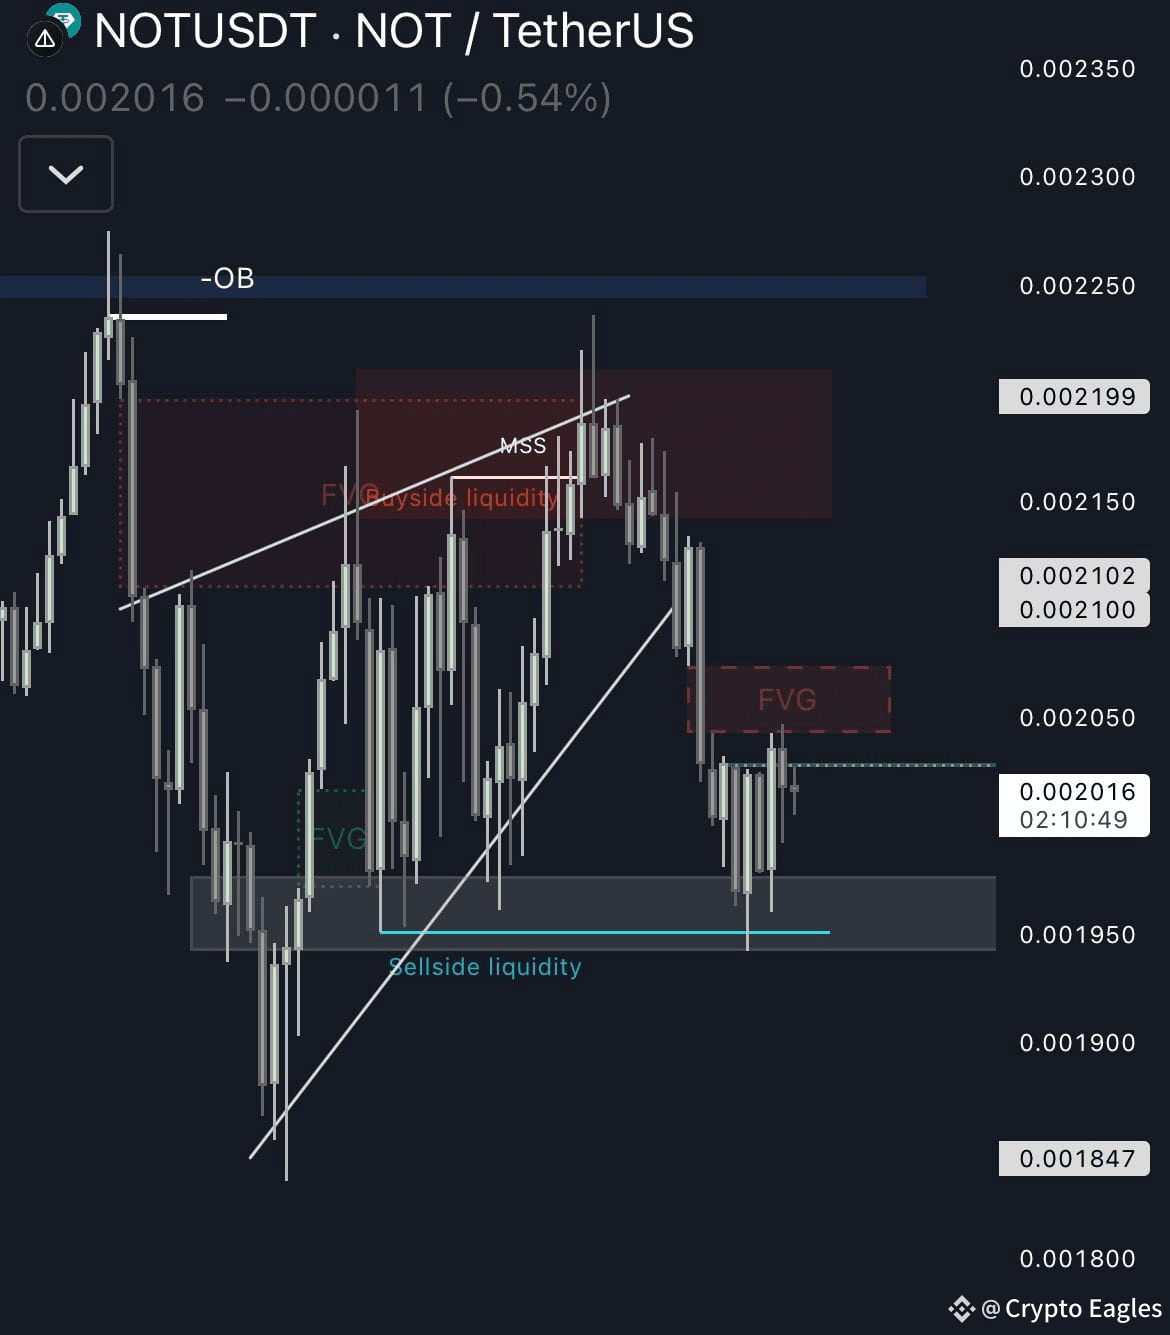
Symmetrical Triangle Pattern: Awaiting a Breakout or Breakdown
Technically, Notcoin is currently in a consolidation phase, trading within a symmetrical triangle pattern. This chart formation indicates that price action is narrowing, and a breakout is becoming increasingly likely.
Bullish Scenario: If it can break above the $0.0022 level and close a daily candle above this price, it could signal the start of a bullish trend, with the next key target at $0.00247. Such a move would indicate a shift in market sentiment toward bullishness.
Bearish Scenario: Conversely, if the price breaks below the ascending trendline and falls under the $0.0019 support level, $NOT could experience a 13% decline, targeting the $0.0016 zone. A breakdown of this support would signal further bearish pressure and potential downside continuation.
With over 2.8 million holders and 61% of the supply on-chain, this token has built one of the most active communities in Web3
Over $220 million has been distributed through the tap-to-earn program – making Notecoin truly community-driven
It’s also gained serious traction in trading, with more than $1 billion in DEX volume and was officially listed on Binance, giving it strong exposure
Currently, the Supertrend indicator remains bullish, reflecting that the broader trend is still upward. However, this could quickly change if the price fails to hold support, flipping the market sentiment toward a bearish bias.
Conclusion: Key Levels to Watch for $NOT's Next Move
Notcoin is at a pivotal point in its price action, with critical support and resistance levels determining the next significant move. The token’s trading volume, outflows, and the symmetrical triangle pattern suggest that a breakout could be on the horizon. However, with market sentiment remaining mixed, traders must keep an eye on key price levels, including the $0.00193 and $0.00206 zones, as well as the trendline support for signs of a breakout or breakdown.
A sustained move above $0.0022 could signal a bullish continuation toward $0.00247, while a failure to maintain support could lead to further downside toward $0.0016. As always, the market remains fluid, and traders should remain cautious and adapt to any price movements in the coming sessions.
#Notcoin
