
Ethereum is up nearly 3% in the last 24 hours, and the weekly loss has been trimmed to just 3.5%. With price now closing in on the psychological $4,000 level again, both technicals and on-chain metrics are showing signs that the breakout might not be far away.
Three signals in particular are connecting well.
Short-Term Holders Are Accumulating Again
A reliable way to gauge upcoming momentum is to track the wallet activity of short-term holders. These are addresses that have held Ethereum between 1 and 3 months, often linked to fresh accumulation. According to HODL wave data, the percentage of these addresses has risen sharply from 9.57% to 11.93% in just under a month, showing renewed buying activity.
For token TA and market updates: Want more token insights like this? Sign up for Editor Harsh Notariya’s Daily Crypto Newsletter here.
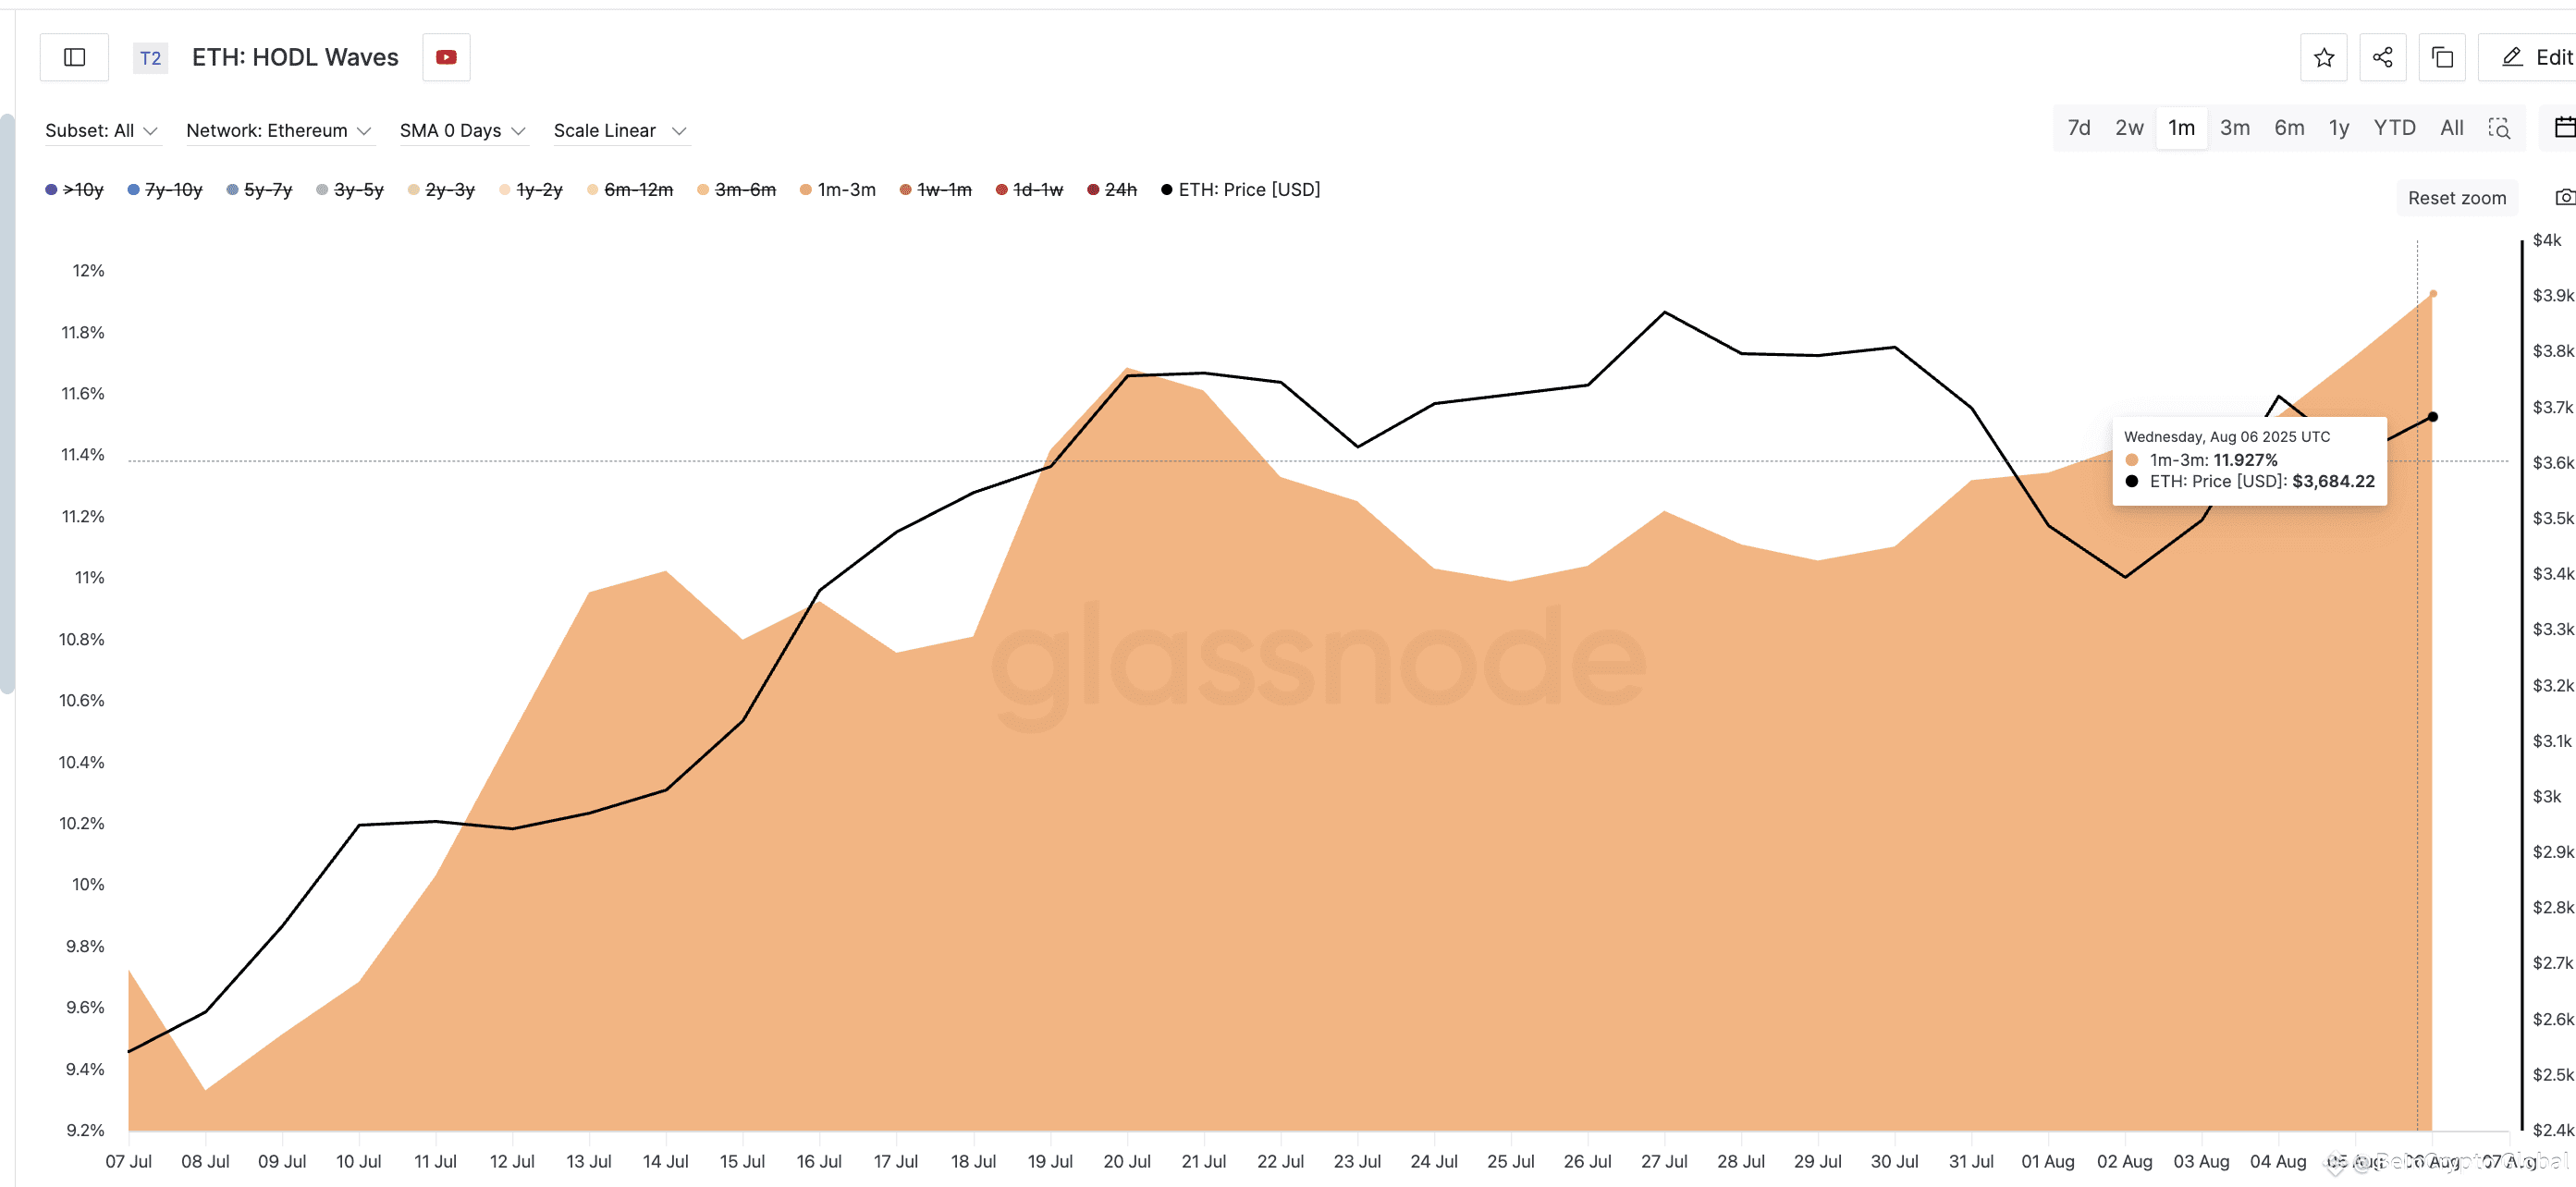 Ethereum HODL waves: Glassnode
These holders often enter during consolidation and play a role in initiating breakouts.
HODL Waves show the percentage of Ethereum supply held over different durations. The 1–3-month cohort is especially important for identifying accumulation during transitional phases.
SOPR Suggests Sellers Are Losing Steam
Supporting this buying activity is the behavior of the SOPR metric, or Spent Output Profit Ratio. This indicator tracks whether coins being sold are in profit. A declining SOPR, while price remains steady or climbs, often signals that profit-taking has slowed.
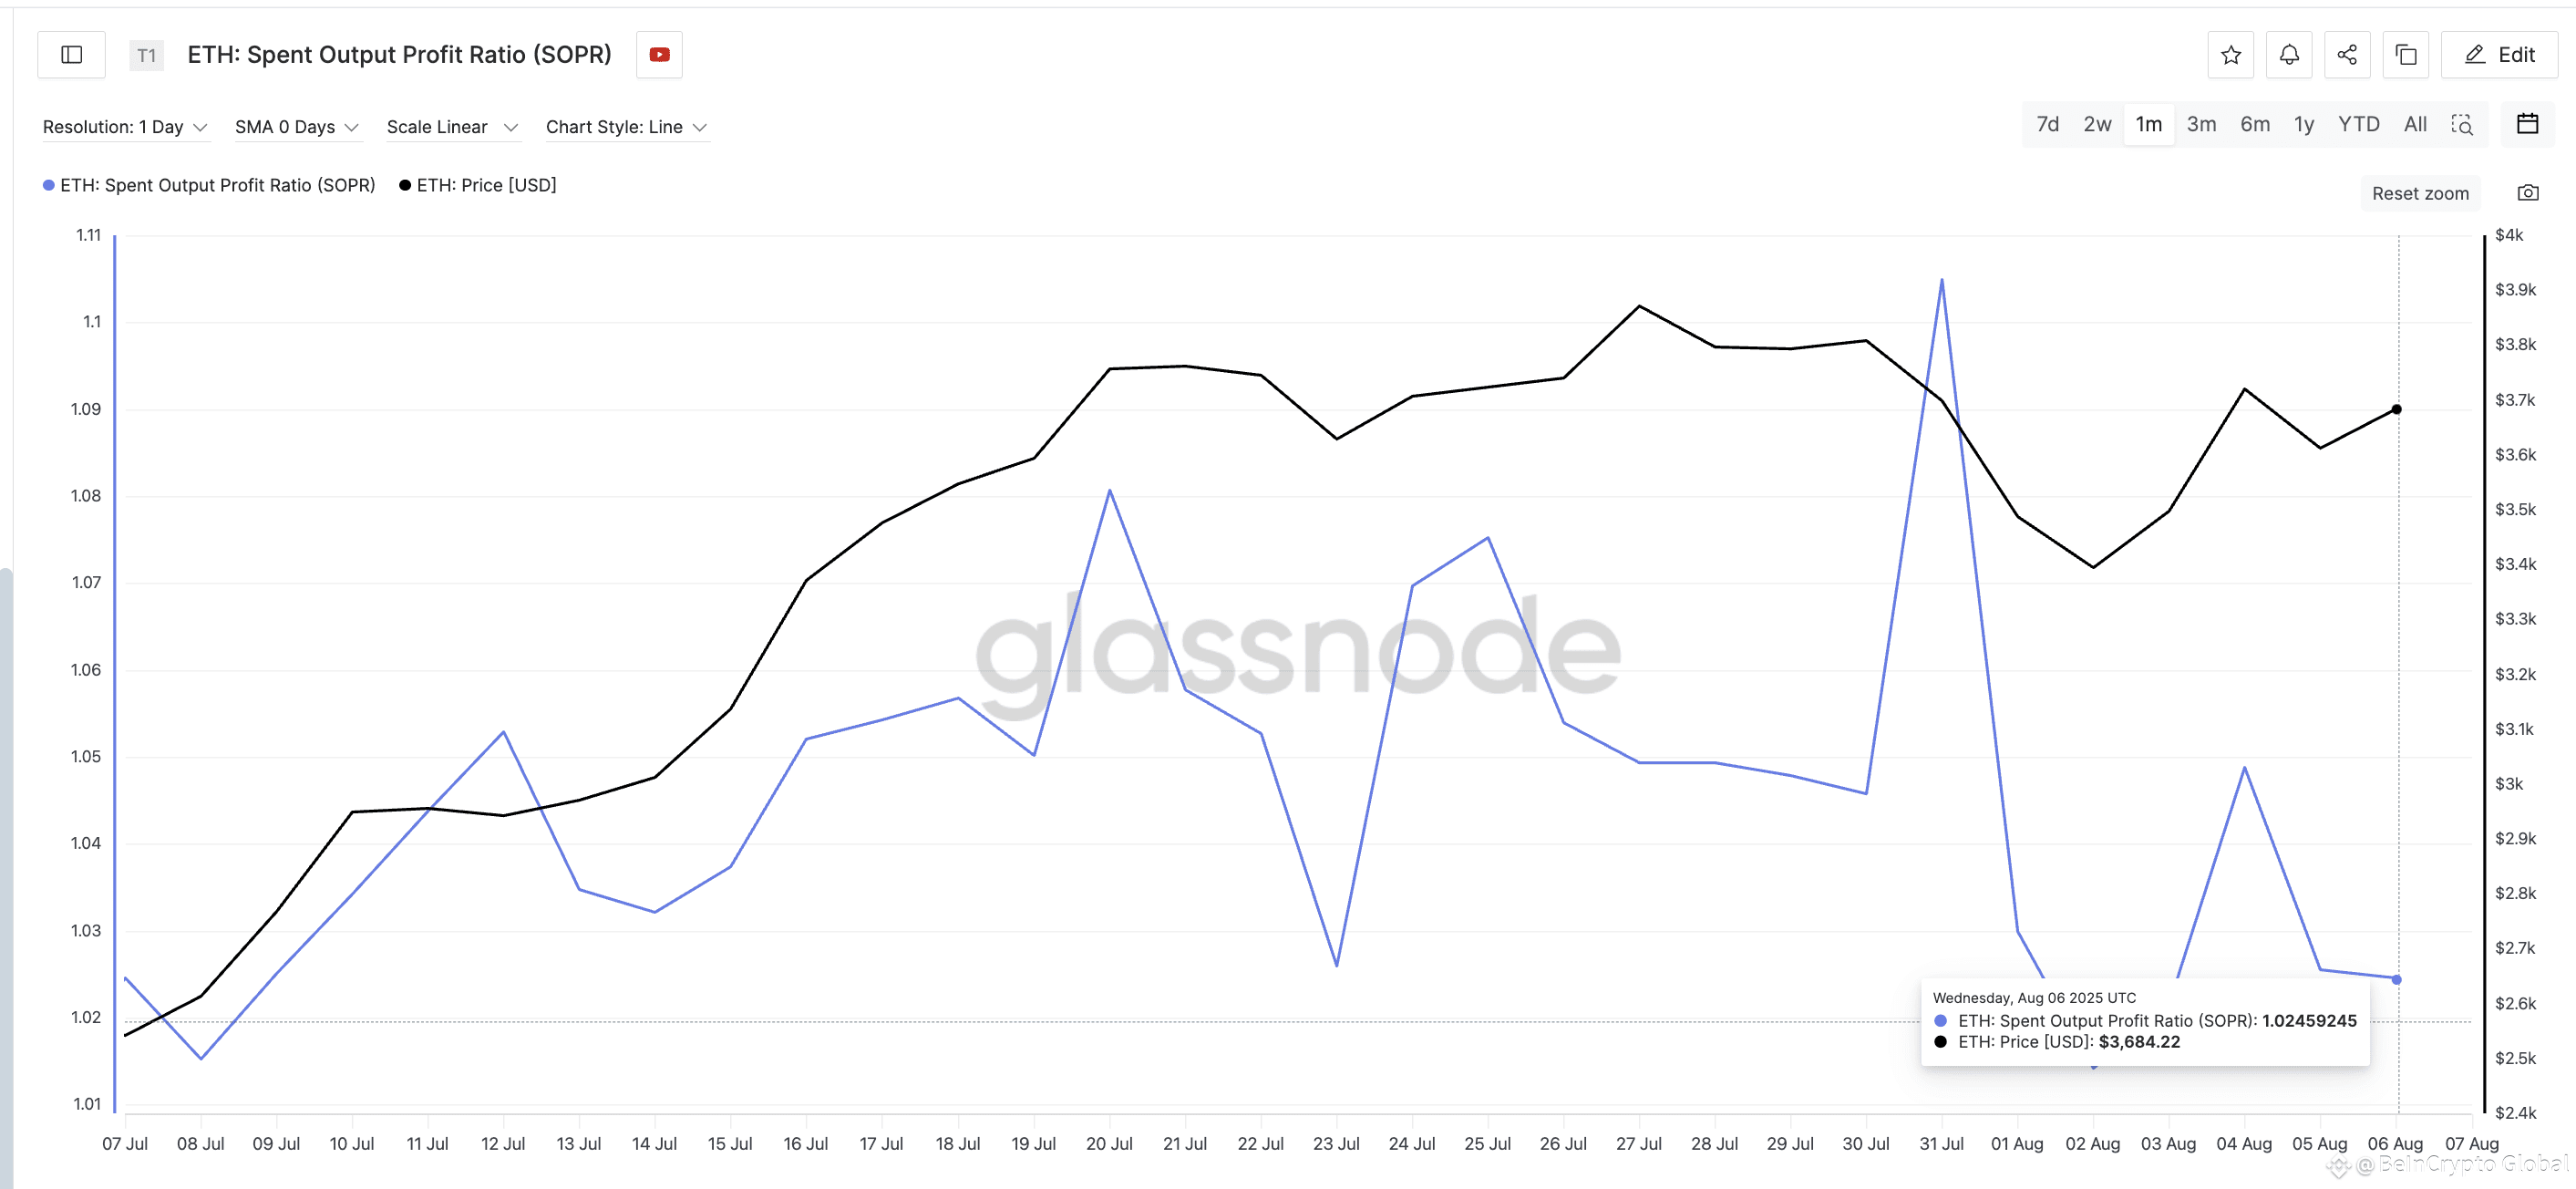 SOPR Ethereum: Glassnode
That’s exactly what’s happening now. SOPR has dropped, even as Ethereum’s price has pushed slightly higher. The last time this happened, late July, ETH gained momentum soon after. It’s a typical bottom formation pattern. If this behavior continues, it adds strength to the idea that $4,000 is within reach.
SOPR helps measure market conviction. When sellers aren’t taking profits despite price gains, it suggests growing confidence in further upside.
Resistance Is Thinning as Buyers Step In; Good For the Ethereum Price Action?
On-chain data from IntoTheBlock’s Global In/Out of the Money model shows that the current resistance zone is weak. Only 11.95 million addresses sit just above Ethereum’s current price of $3,720. That means fewer holders are in a position to sell at breakeven, lowering the chances of heavy resistance between here and the $3,937 level.
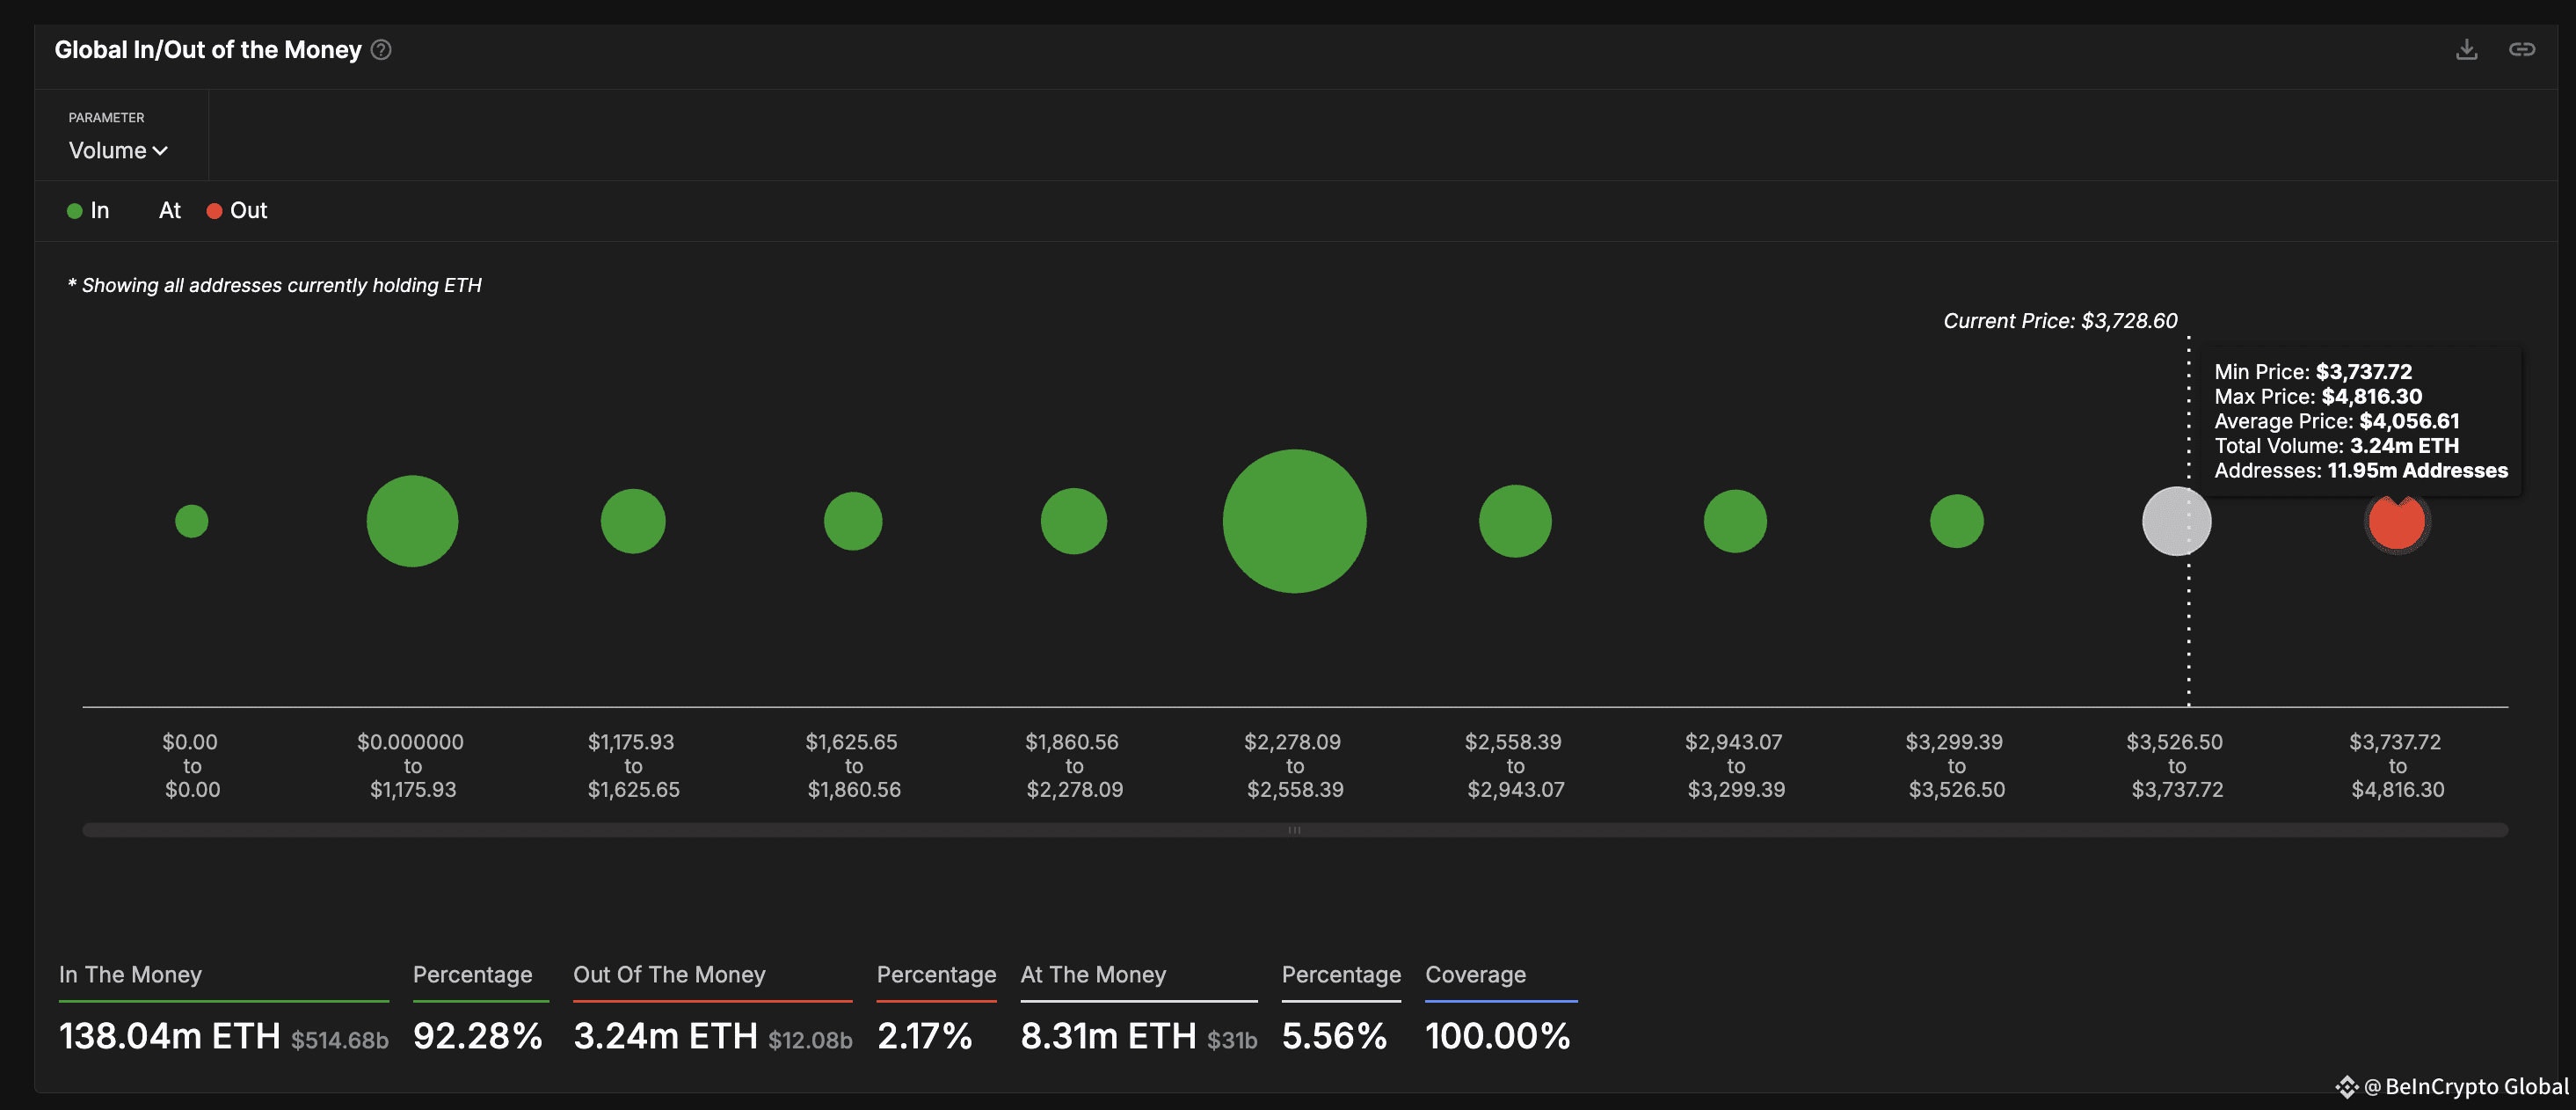 Ethereum price and sell walls: IntoTheBlock
This level; $3,937, is critical according to the weekly price chart. In past cycles, Ethereum got rejected near $4,100; March 2024 and twice in December 2024. But this time, ETH price hasn’t tested $4,000 yet, despite holding above $3,300 since June. This makes a retest of the $4,000 mark long overdue.
Note: A weekly chart is used to cut out the range-bound movement; something ETH has been stuck with for a while now.
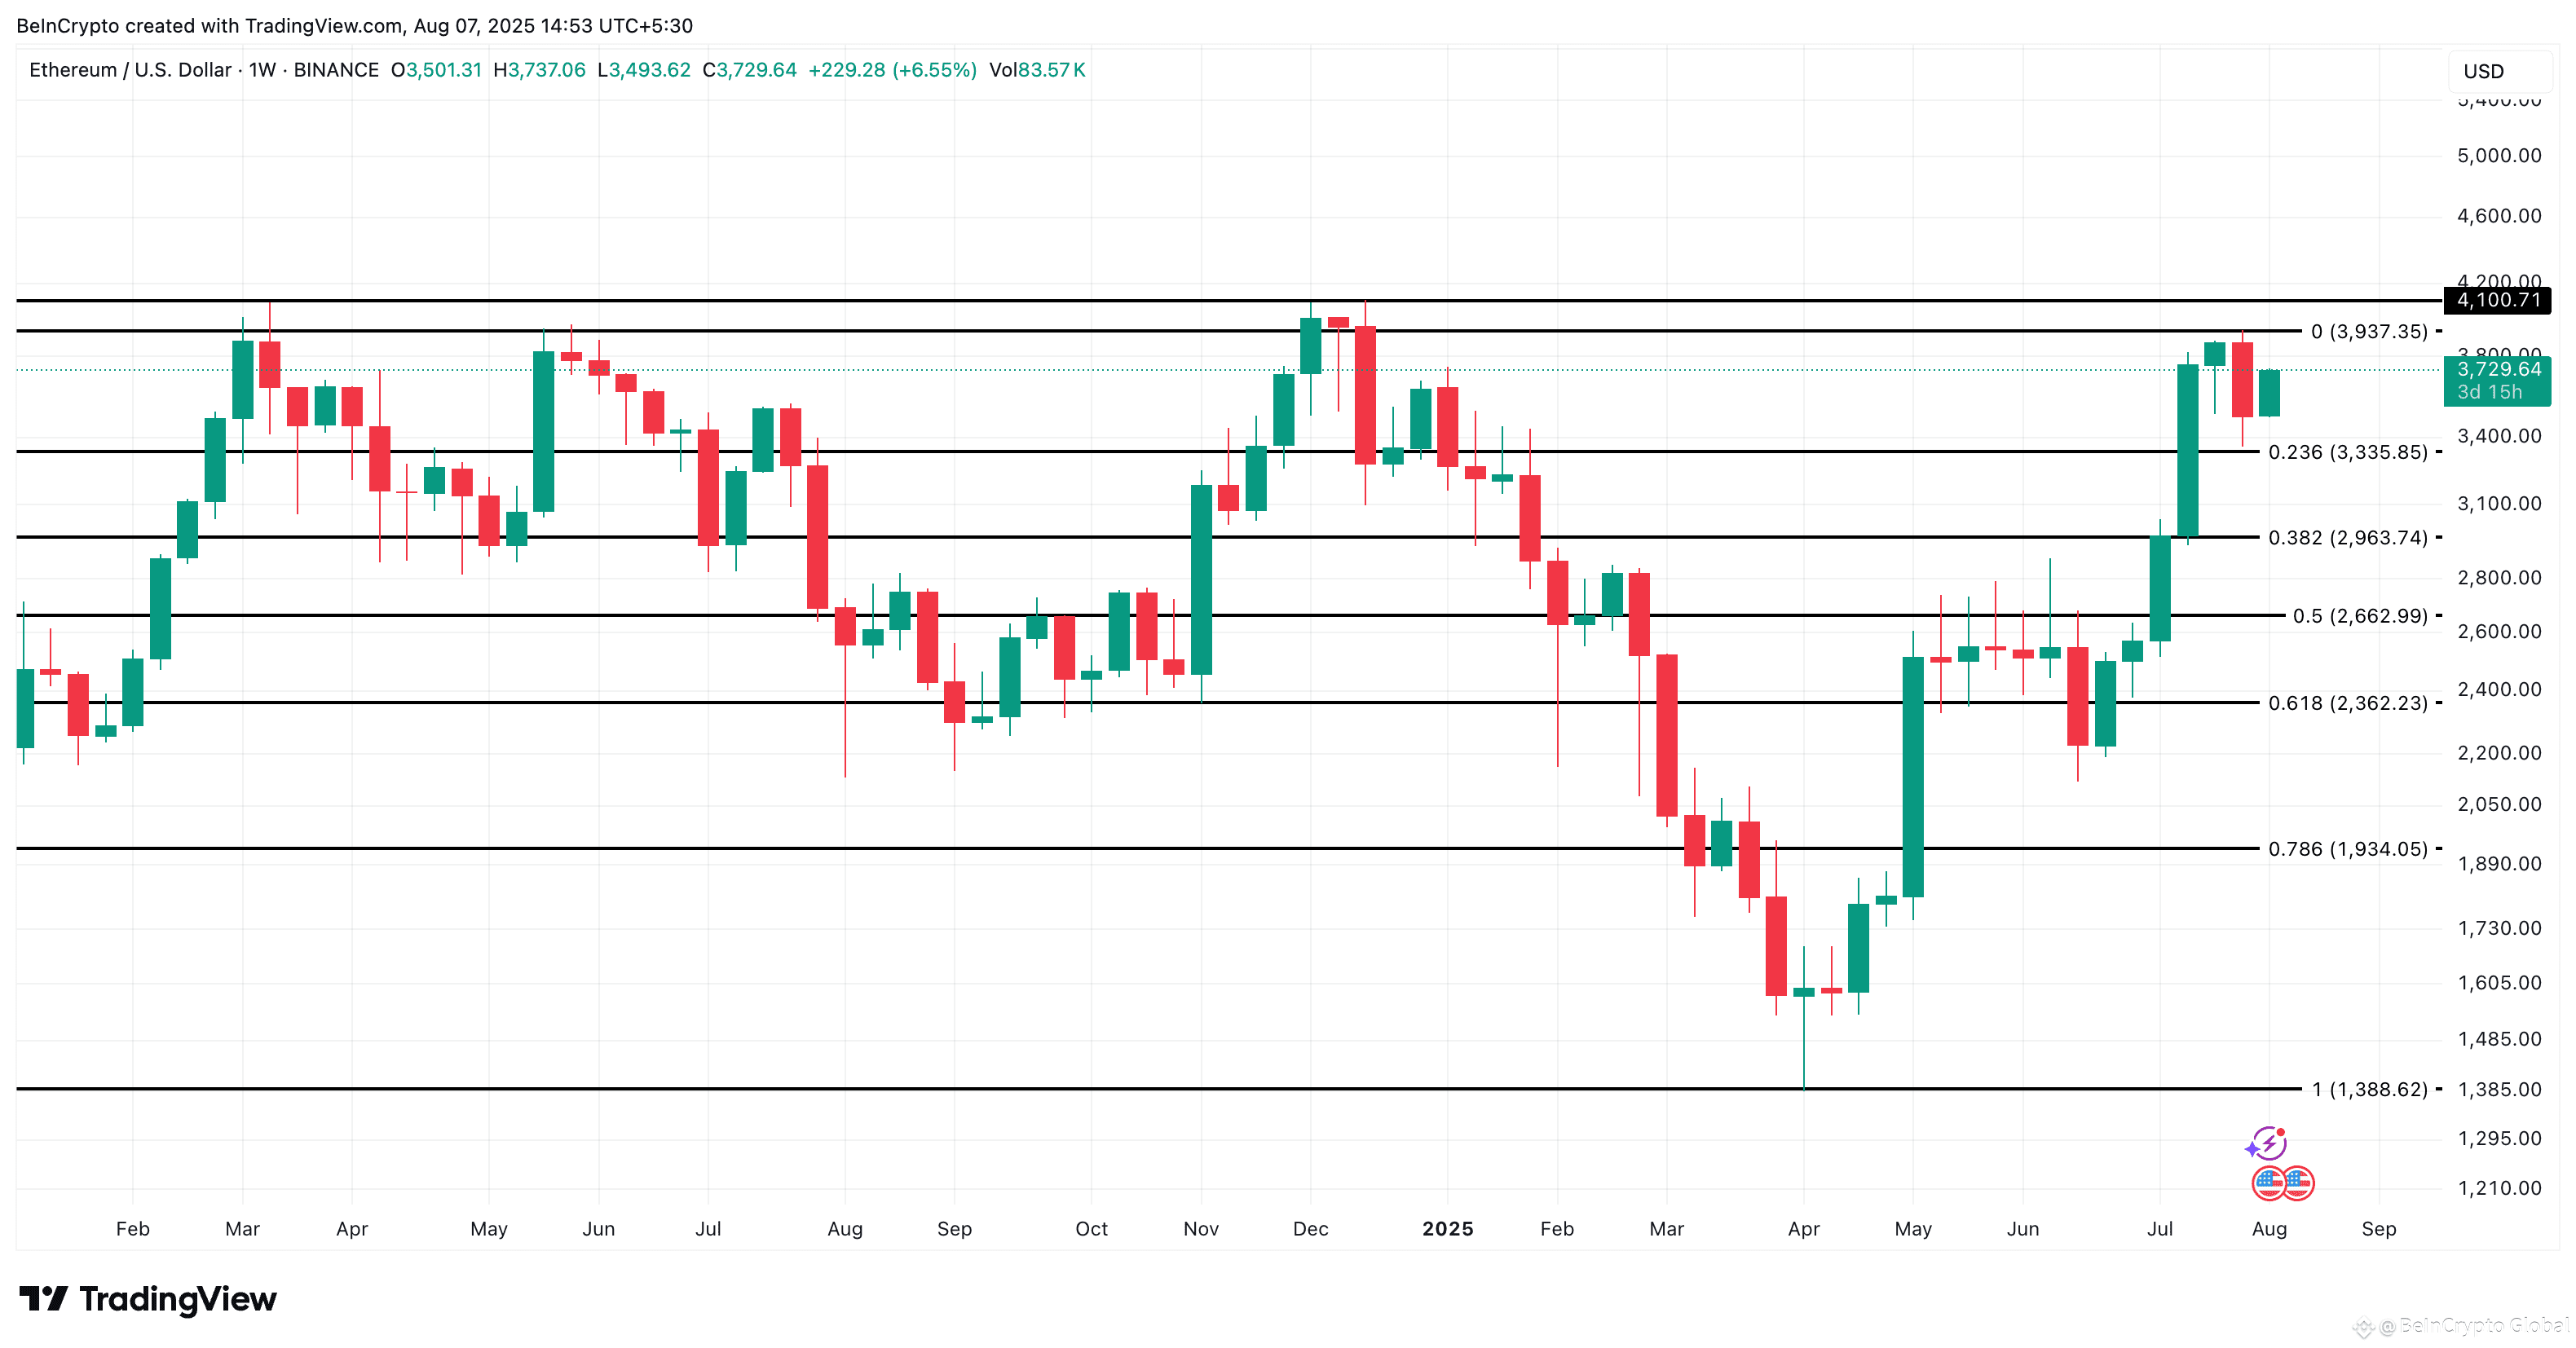 Ethereum price analysis: TradingView
If Ethereum convincingly clears $3,937, the lack of sell pressure above makes a rally past $4,000 increasingly likely. However, if the sell pressure increases with SOPR dipping in line with price corrections or if the short-term buyers flip into the sellers, $3,335 would be a key level to watch.
A breach under that, more so on a larger timeframe, can turn the structure bearish, invalidating the current hypothesis.
