
☕ Identifying the Strategy: Cup and Handle
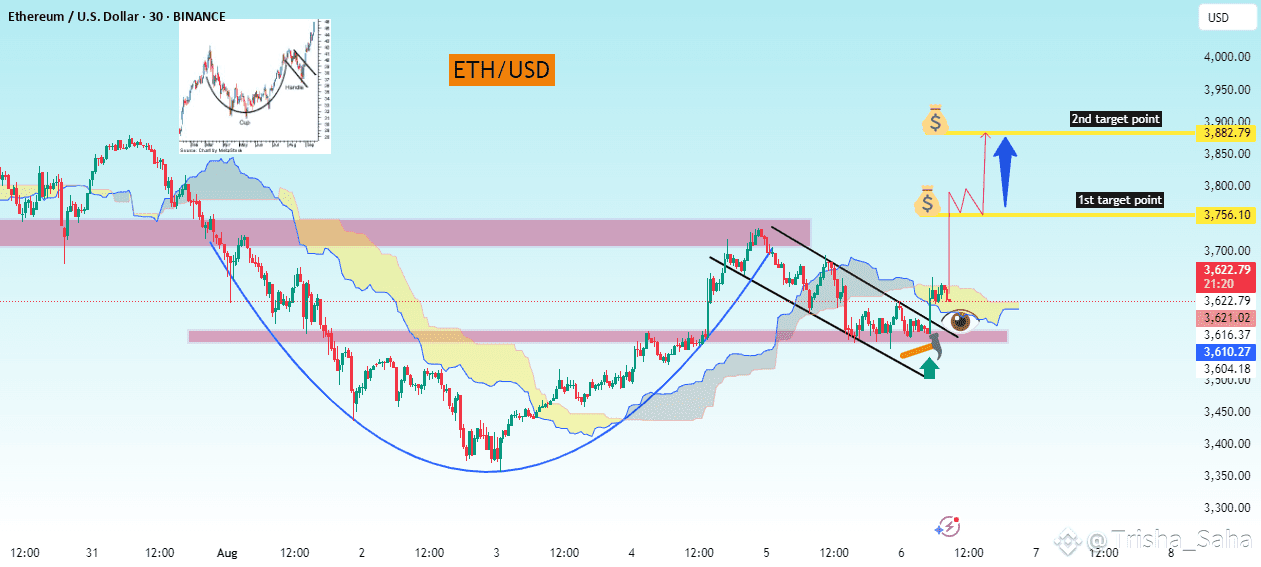
The pattern highlighted in your chart is a "Cup and Handle" formation.
✅ Characteristics in your chart:
1. Cup Shape (Rounded Bottom):
Seen from the drop around August 1 to the recovery by August 4–5.
This curved bottom forms the "cup".
2. Handle:
A small pullback or downward channel formed after the cup.
It's shown by the descending channel (parallel black lines) — this is the "handle".
3. Breakout Point:
Once the price breaks out of the handle pattern, it's considered a bullish signal.
Your chart shows an up arrow after the breakout of the handle.
---
🎯 Target Points (As marked on your chart)
📌 First Target Point:
Price: $3,800.00 (marked in yellow)
This is usually the distance from the bottom of the cup to the breakout point, projected upward.
📌 Second Target Point:
Price: $3,920.63 (marked in gray)
This is an extended target, often used by more aggressive traders.
It might align with previous resistance levels.
---
🧠 Summary
Item Value
Pattern Cup and Handle
Timeframe 30-minute chart
Current Price ~$3,628.30
First Target $3,800.00
Second Target $3,920.63
Trend Direction Bullish (after breakout)
---
📈 Trade Idea (Based on Pattern):
Entry: Near breakout of the handle (already broken)
Stop Loss: Below handle low (~$3,610–$3,580 zone)
Targets:
TP1: $3,800
TP2: $3,920+
#BuiltonSolayer #IPOWave #BTCUnbound #CFTCCryptoSprint #BinanceHODLerPROVE