

XRP traded at $2.85 to $2.88 per coin over the last hour on August 3, 2025, marking a 2.2% decline over the past 24 hours. The cryptocurrency’s market capitalization stood at $170.83 billion, with a 24-hour trading volume of $7.48 billion and an intraday price range of $2.75 to $2.94.

XRP
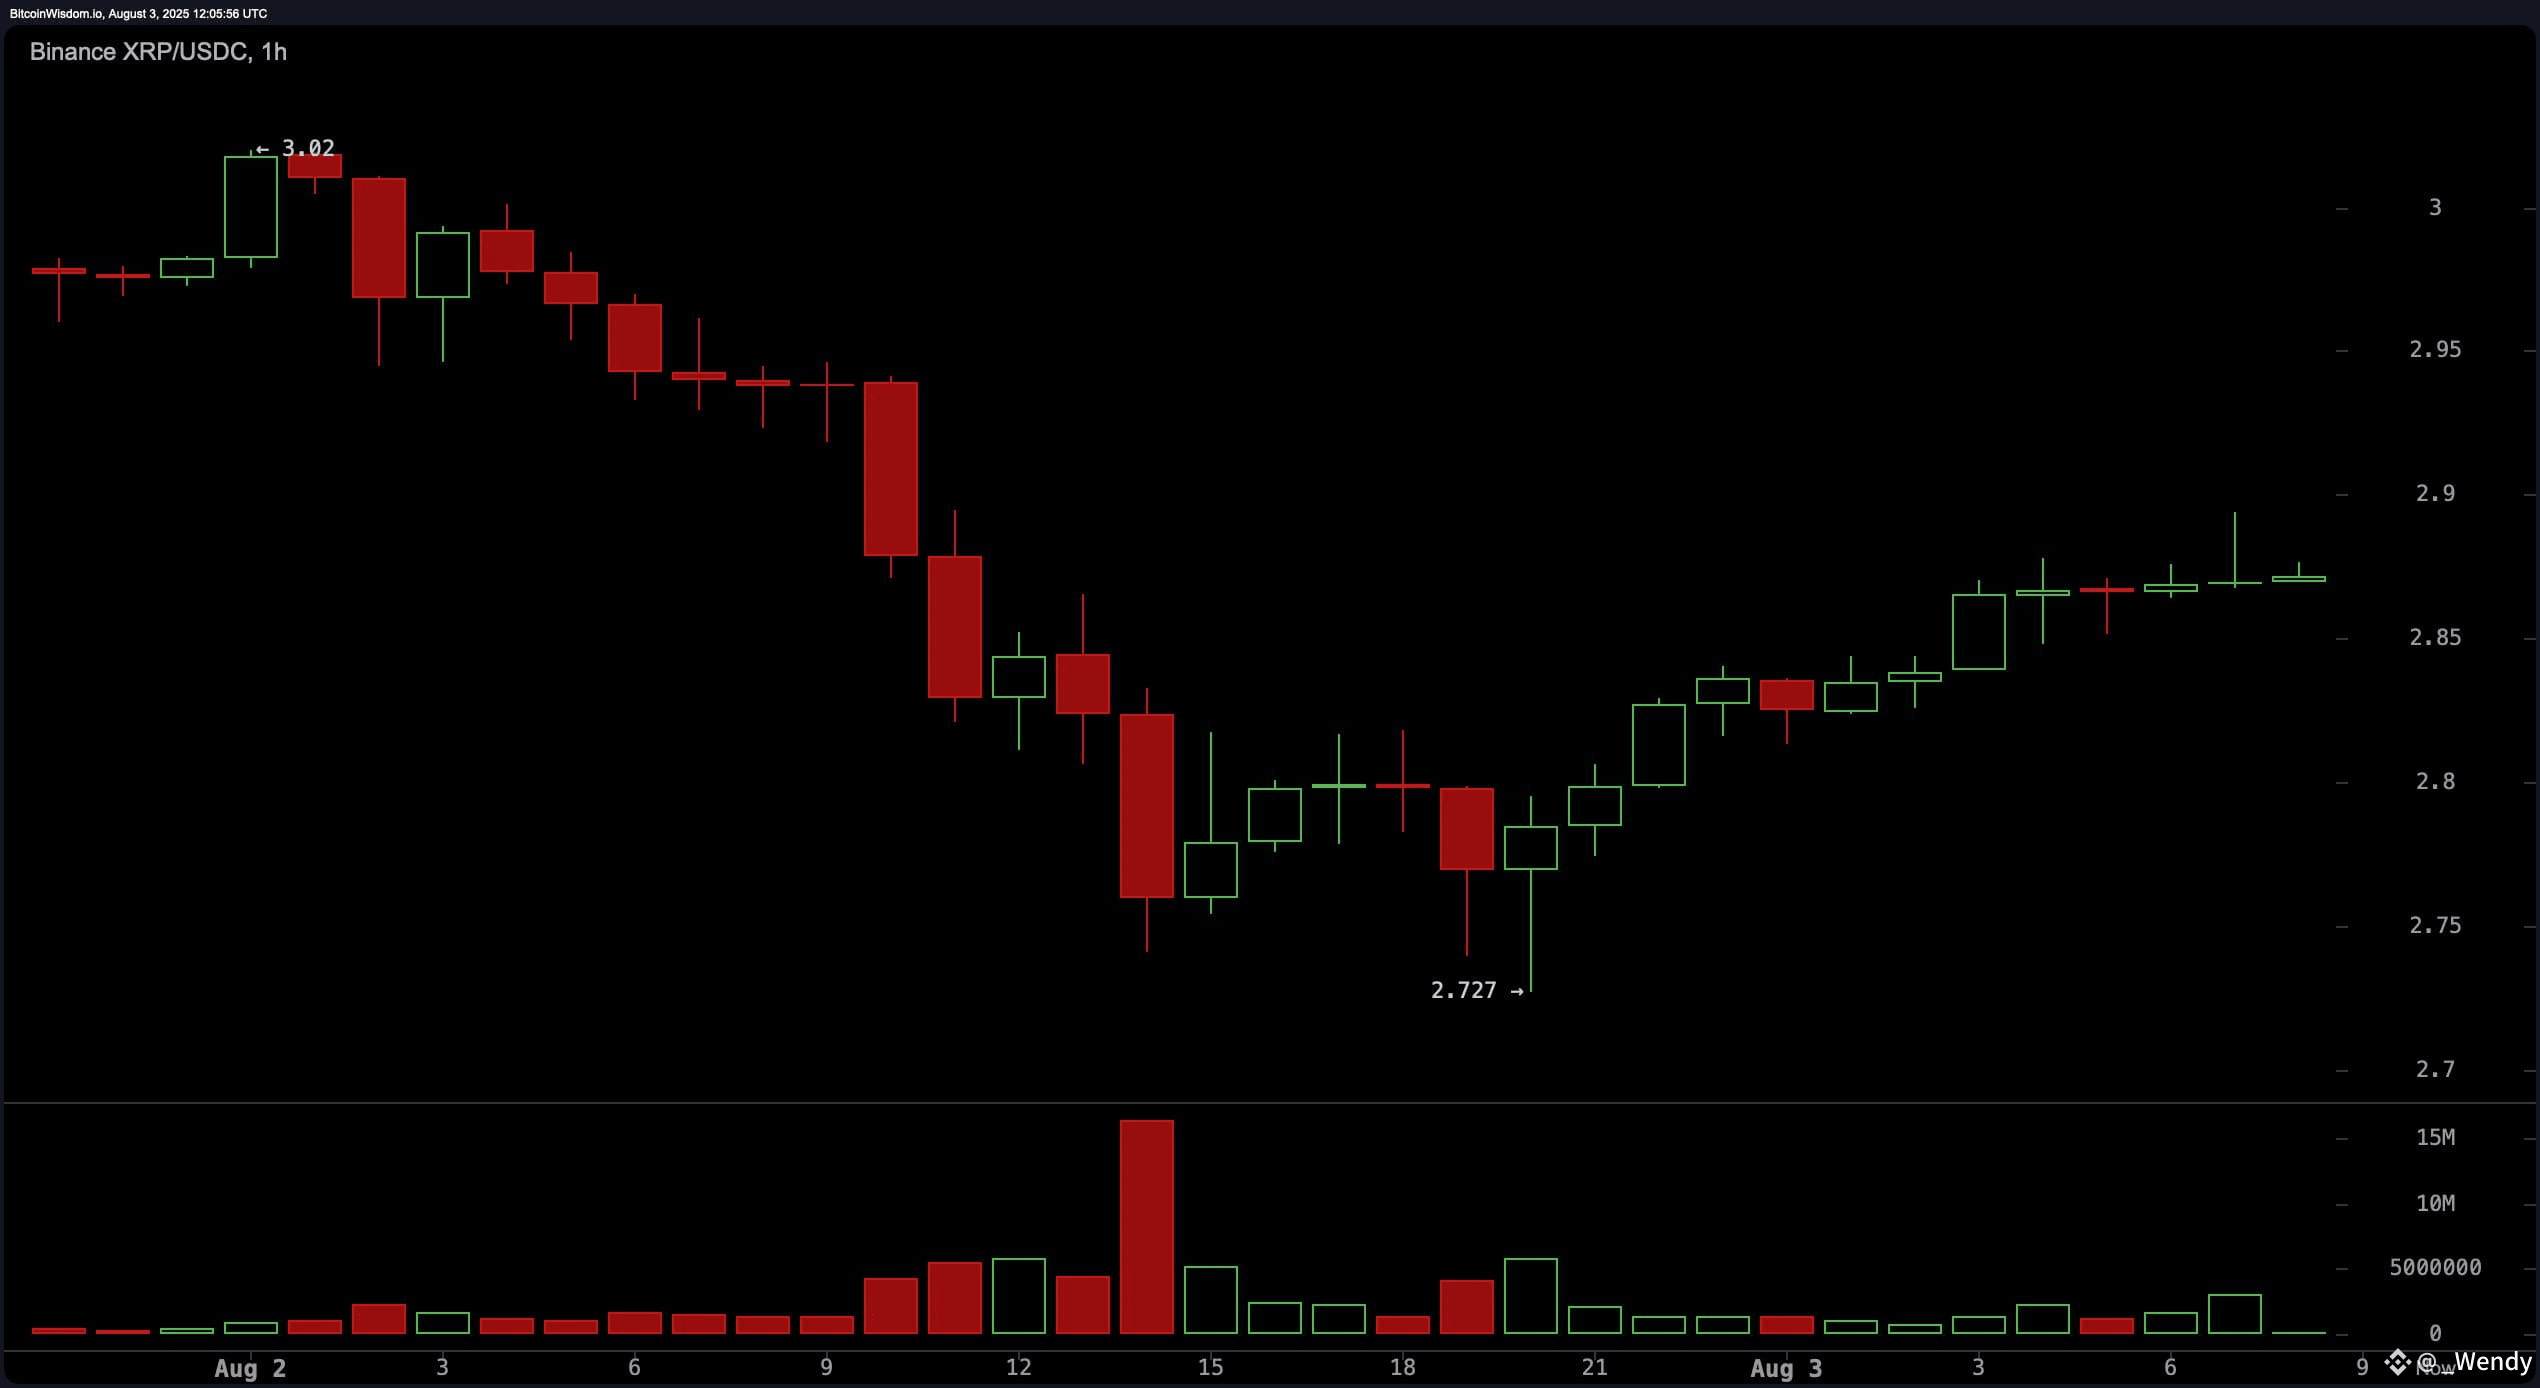
The 1-hour chart for XRP/USDC shows a gradual reversal pattern forming a rounded bottom following the recent $2.727 low. Momentum appears to be building as buying volume increases on green candles, pointing to growing interest from intraday traders. Immediate resistance lies between $2.88 and $2.90, while $2.80 serves as short-term support. Scalping strategies may be favorable if the price pulls back into the $2.82–$2.85 zone with a tight stop-loss below $2.80 and potential short-term targets between $2.95 and $3.00.
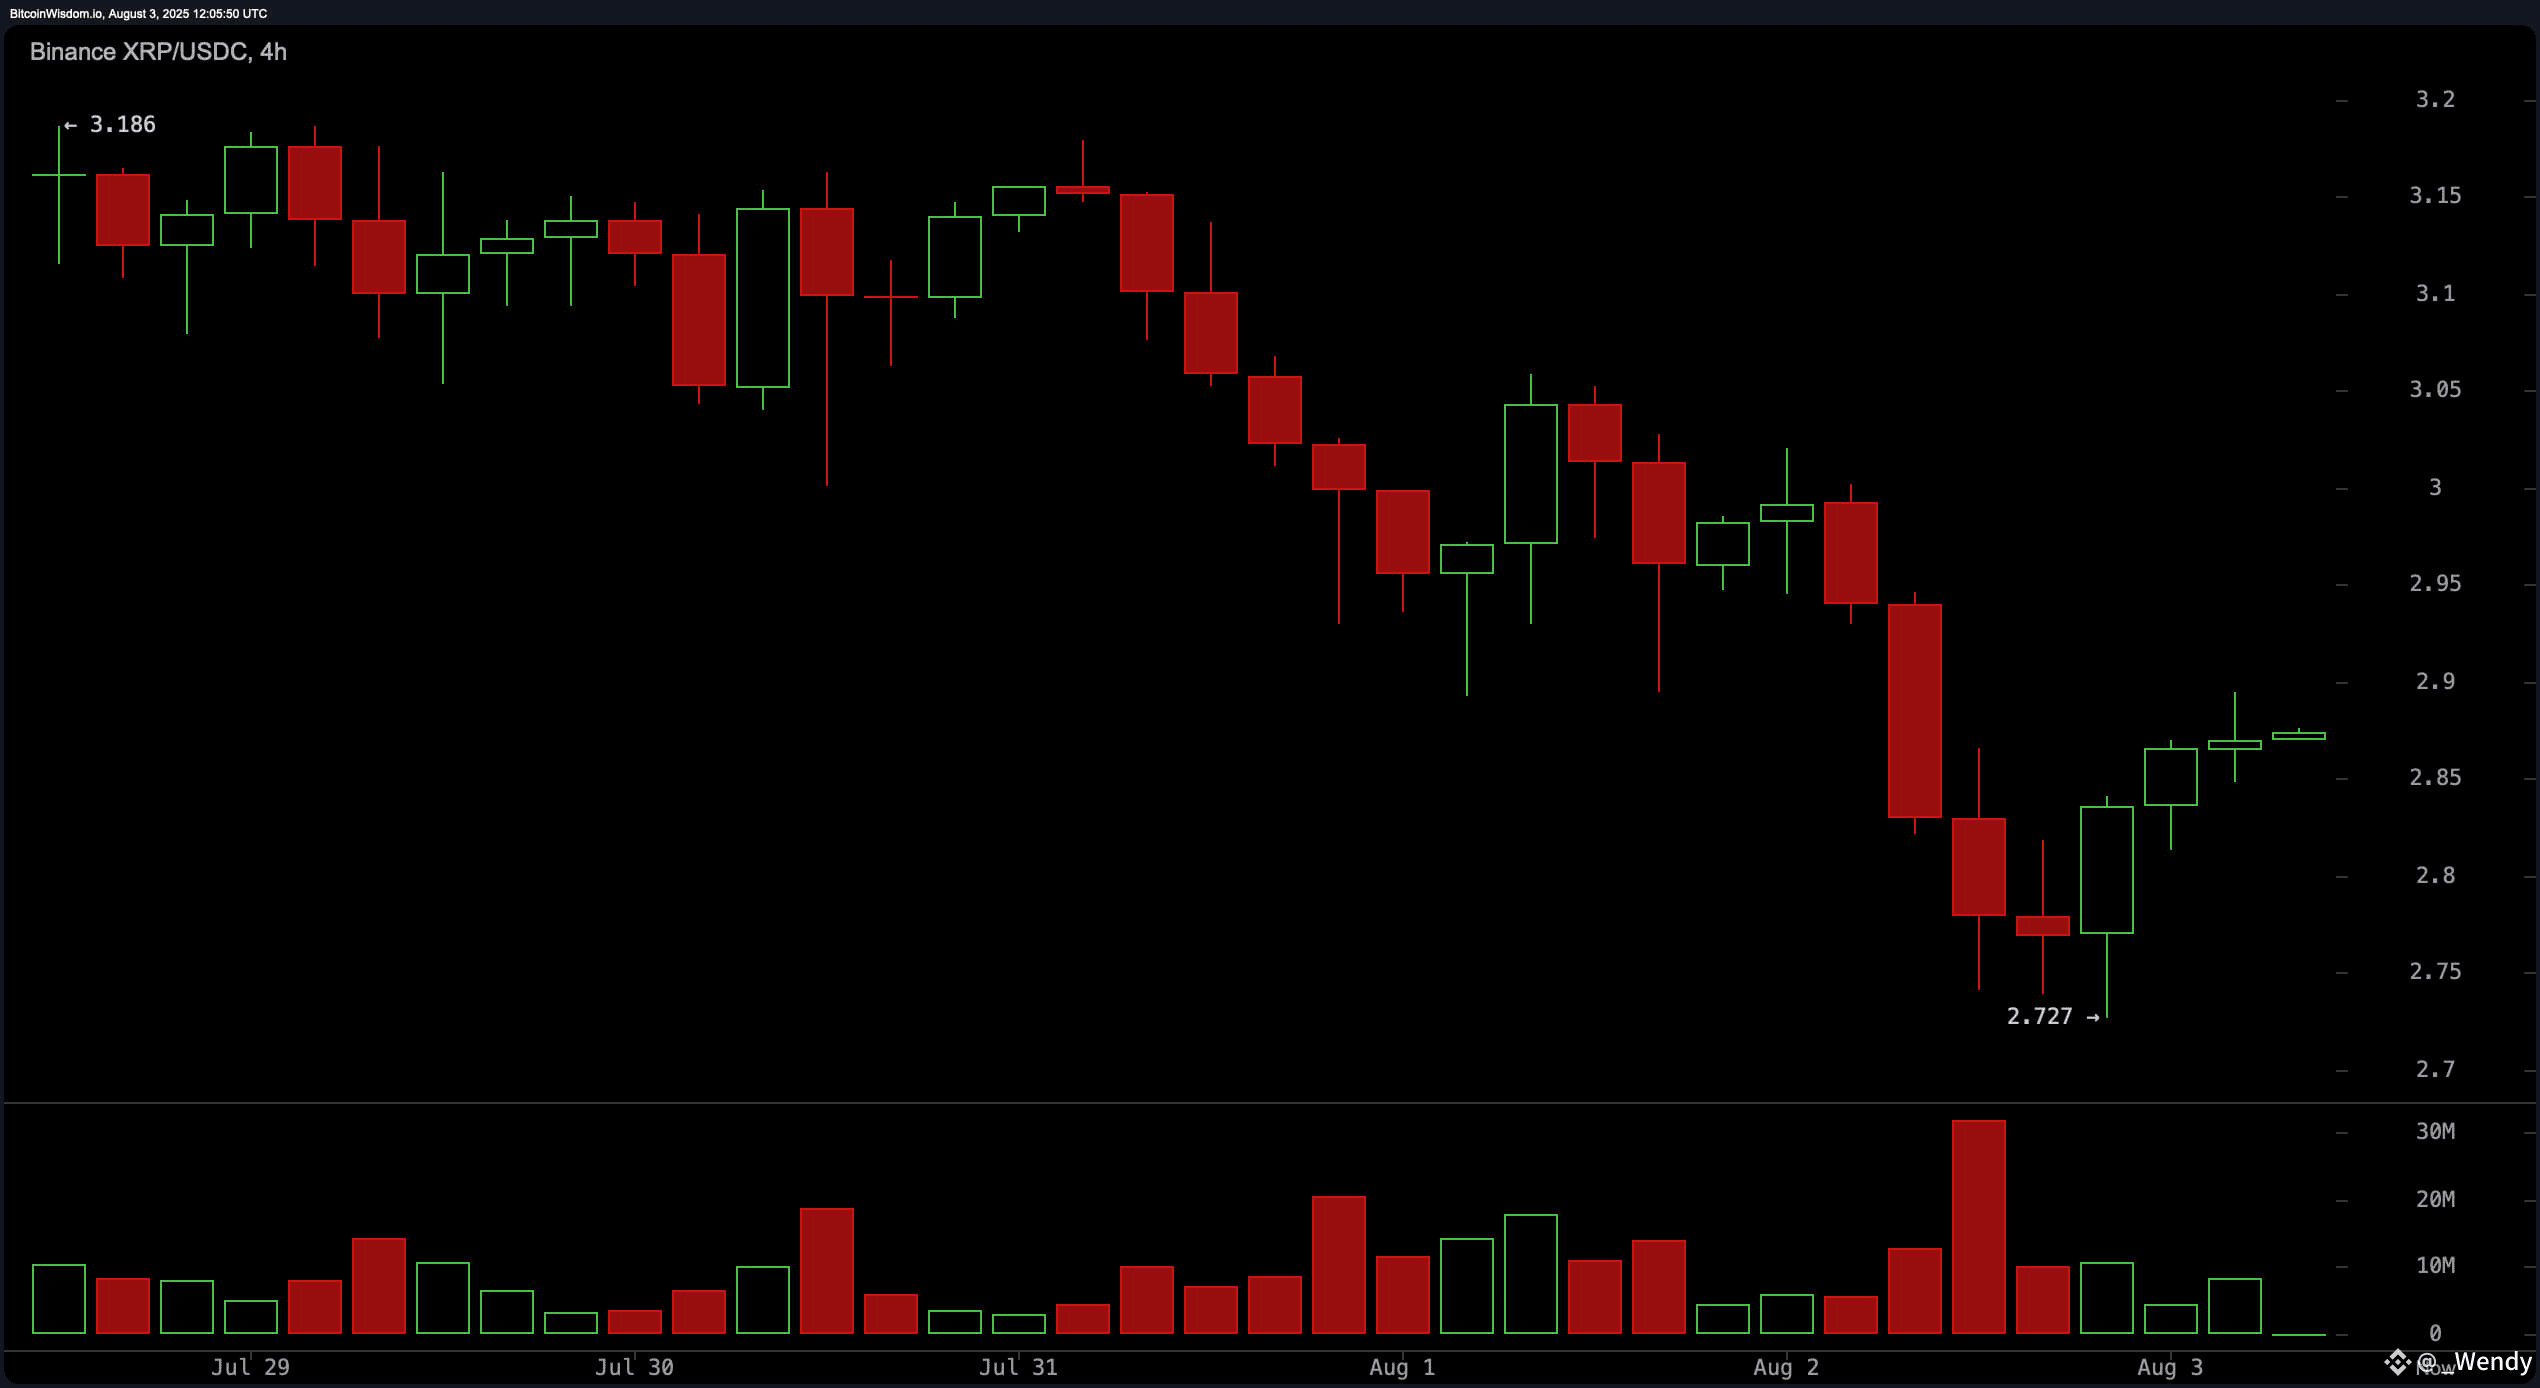
On the 4-hour chart, the pair has entered a clear corrective phase characterized by lower highs and lower lows. However, a double bottom at $2.727 followed by a breakout near $2.85 indicates a potential shift in structure. Volume spiked significantly during the second bottom formation, suggesting possible capitulation and reentry by institutional players. Maintaining support above $2.85 with confirmation volume could reinforce a bullish reversal, although the $3.00 level remains a critical resistance point to monitor.
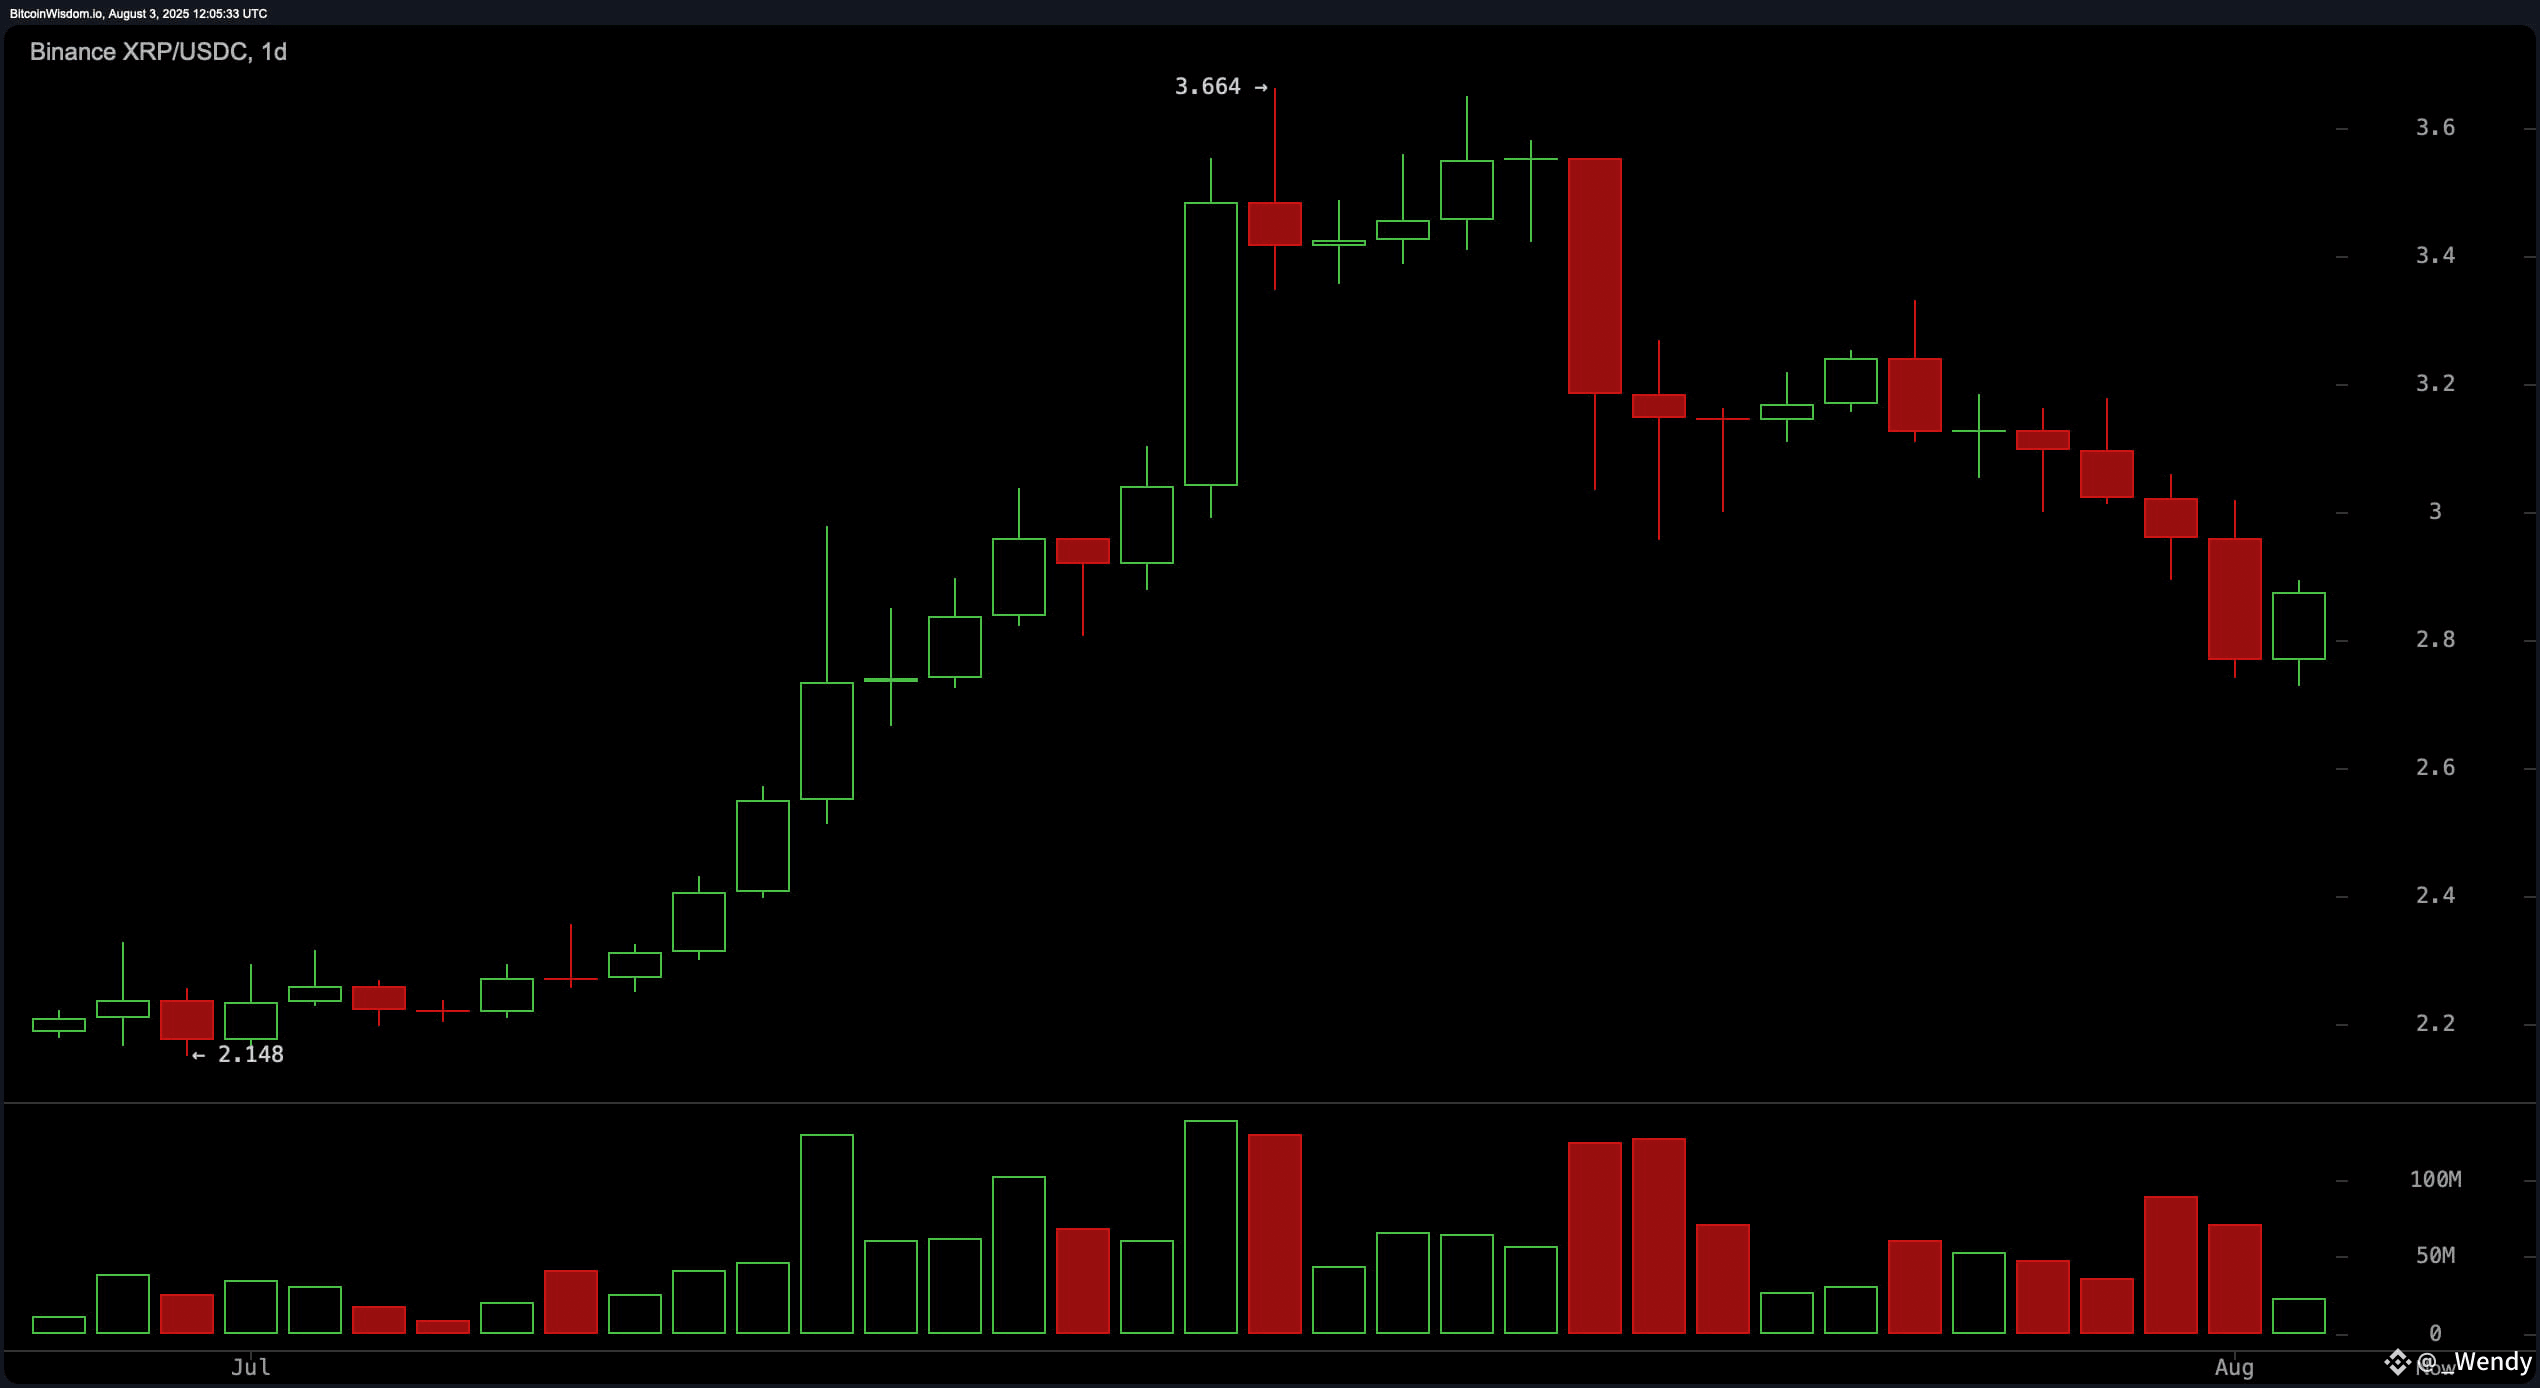
Daily chart analysis shows XRP peaking at $3.664 in July before reversing into a short-term downtrend. Key support has formed at $2.70, with the most recent bounce near this level indicating potential bottoming behavior. The last daily candle presented a bullish recovery pattern, suggesting buyers may be attempting to reclaim higher ground. A confirmed daily close above $2.90, coupled with follow-through volume, could validate a trend reversal and pave the way for a test of the $3.00–$3.30 resistance zone.
XRP’s oscillators reveal a mixed sentiment. The relative strength index (RSI) sits at 46.07, indicating neutral momentum, while the Stochastic oscillator is also neutral at 9.31. The commodity channel index (CCI) reads −130.59, signaling bullish conditions, and the momentum oscillator stands at −0.27, also suggesting another positive opportunity. Conversely, the moving average convergence divergence (MACD) level of 0.062 indicates a bearish signal, as does the average directional index (ADX) at 36.32, which reflects a non-trending but moderately strong directional move. The Awesome oscillator (AO) today stands at 0.095 on the daily, which remains neutral.
A broader look at the moving averages (MAs) points to bearish pressure in the short term and bullish undertones in the long term. All short-term indicators, including the 10-period and 20-period exponential moving averages (EMA) and simple moving averages (SMA), are flashing negative signals with values above the current price. Conversely, longer-term indicators such as the 50-period, 100-period, and 200-period EMAs and SMAs all reflect bullish signals, confirming that XRP remains structurally positive despite the short-term volatility. This divergence between short and long-term indicators suggests a consolidation phase with a high probability of breakout upon volume confirmation.
Bull Verdict:
If XRP maintains support above $2.85 and confirms a daily close above $2.90 with strong volume, the current structure suggests a bullish reversal is underway. With long-term moving averages aligned to the upside and signs of bottoming across multiple timeframes, XRP could be primed to retest the $3.00–$3.30 resistance range in the near term.
Bear Verdict:
Despite recent signs of stabilization, XRP remains under short-term bearish pressure with key resistance at $2.90 and $3.00 capping further upside. Failure to reclaim these levels, coupled with persistent sell signals from short-term moving averages and the MACD, may lead to renewed downside toward the $2.70 support zone or lower.
