🔍 Market Snapshot
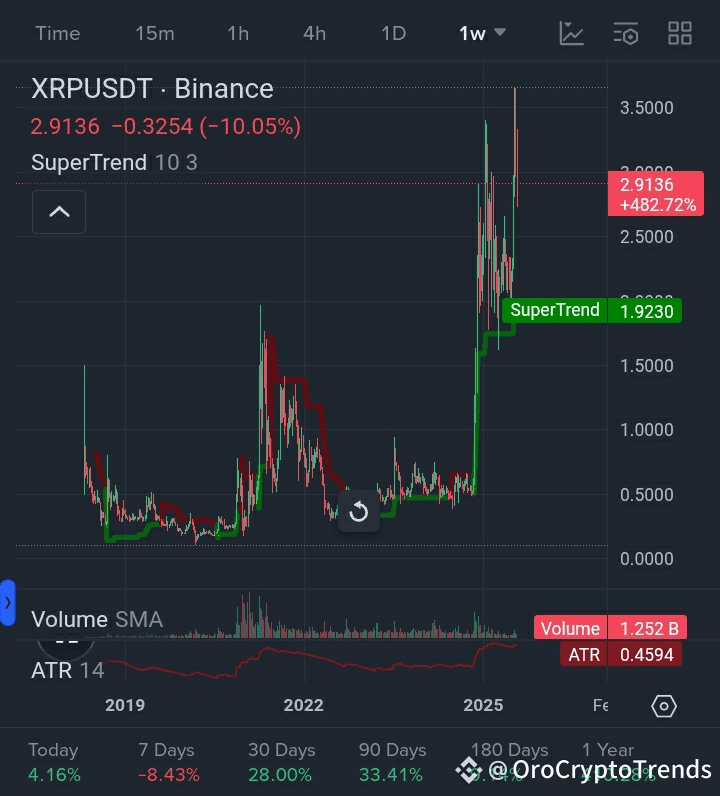
As of August 1, 2025, XRP is trading just above the $3.00 mark, after bouncing from a descending triangle’s support zone. Over the past two weeks, XRP has ranged between $2.82 and $3.18, showing signs of tightening volatility and growing trader anticipation.
Current Price: ~$3.03
7-Day Change: +4.6%
24-Hour Volume: $2.3 billion
Market Cap Rank: #6
Key Resistance: $3.20 (Triangle Breakout)
Key Support: $2.85 (Triangle Base)
📉 Triangle Pattern Analysis
XRP has been consolidating within a descending triangle pattern, typically a bearish setup. However, a breakout above the upper trendline (around $3.20) would invalidate the bearish thesis and suggest bullish reversal strength.
Support: Horizontal at ~$2.85
Resistance: Downtrend line from $3.65
Triangle Apex: Approaching within 10–12 days, suggesting imminent breakout
Historically, descending triangle breakouts to the upside often produce sharp moves, particularly when paired with increasing volume — something traders are closely monitoring now.
📊 RSI, MACD, Volume Signals
Relative Strength Index (RSI):
Currently at 54, recovering from oversold territory
Trending up — no divergence, but showing neutral-to-bullish strength
MACD:
MACD line crossing above the signal line on the 4H chart — an early bullish sign
Momentum is shifting, but it lacks strong follow-through yet
Volume:
Volume profile shows a spike during $2.90 accumulation
Still below breakout-confirmation thresholds — needs 20–30% increase for conviction
🚀 Bullish Scenario
If XRP breaks and closes above $3.20 with volume confirmation, the move could trigger a fast rally toward:
🥇 Target 1: $3.45 (Previous structural resistance)
🥈 Target 2: $3.65 (Fibonacci 1.618 extension from $2.70 swing low)
📈 Bonus Target: $4.10 (Psychological milestone + April 2022 high)
Validation Zone: $3.20–$3.30
Invalidation: Back below $2.85 closes
This would be considered a trend reversal breakout, especially with RSI momentum and MACD alignment.
🧨 Bearish Scenario
Failure to break $3.20 resistance could result in another rejection toward triangle support:
🔻 Support 1: $2.85 (Horizontal base)
🔻 Support 2: $2.72 (Fib 0.786 retracement)
💀 Capitulation Zone: $2.50 if volume surges on breakdown
Watch for MACD bear cross and RSI rolling over under 50 — both signs of rejection confirmation.
🧭 Multi-Timeframe Forecast
Timeframe Bias Key Levels
Short-Term (1–7 days) Neutral-to-bullish Watch $3.20 breakout
Medium-Term (2–4 weeks) Bullish above $3.20 Targets $3.65
Long-Term (3–6 months) Conditional Bullish Potential $4.00 retest if macro remains supportive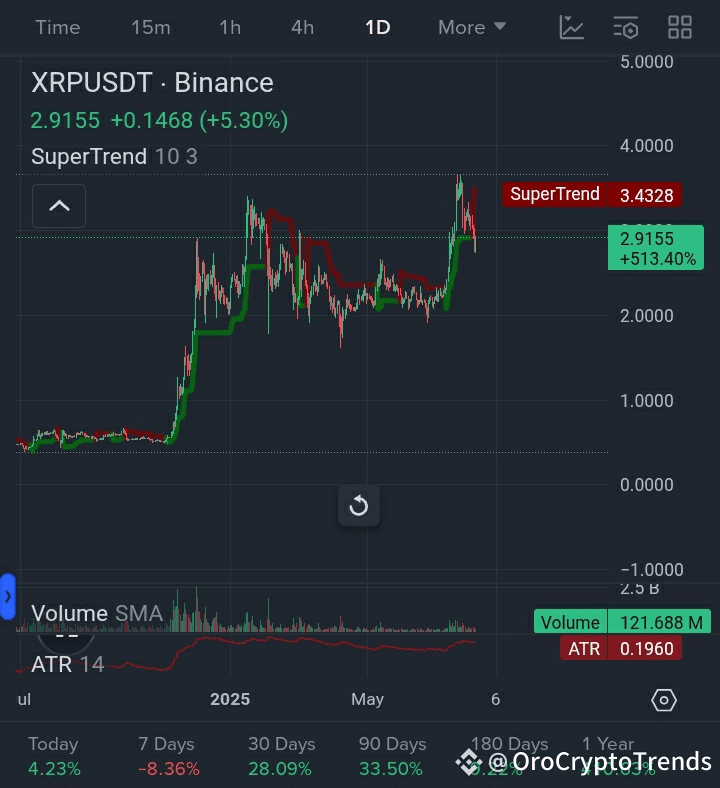
💬 Sentiment Factors
Regulatory Clarity: XRP’s favourable SEC case outcome continues to support upside sentiment
Altcoin Rotation: XRP is benefiting from capital rotation out of meme coins and into higher-cap alts
Social Volume: XRP-related mentions have spiked 18% week-over-week
Fear & Greed Index: Currently at 60 (Greed) — still not euphoric
Sentiment remains cautiously optimistic, with whale wallets accumulating small dips.
🎯 Trader Takeaways
⚠️ Watch $3.20 like a hawk — it’s the breakout trigger
🚨 Use $2.85 as a key stop-loss/reference point
📊 Confirm breakout with volume and RSI above 60
🔄 Stay nimble in this compression zone — breakouts from triangles often lead to sharp moves
🛑 Avoid overleveraging pre-breakout — this is a "wait for confirmation" setup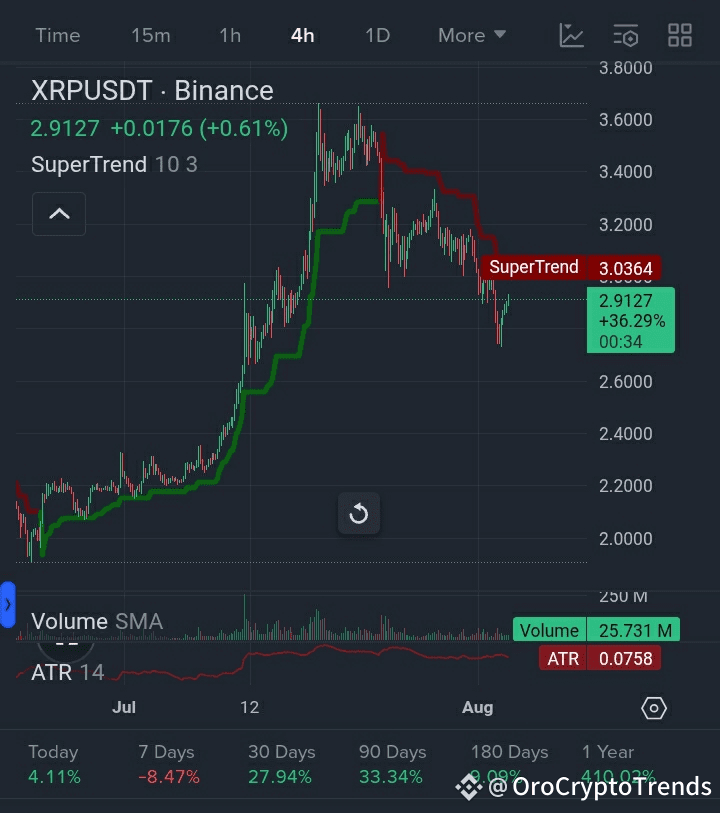
✅ Final Thoughts
XRP is at a technical crossroads.
The $3.00–$3.20 zone is acting as a battleground between bulls and bears. If buyers can reclaim the trendline and volume confirms, $3.65+ becomes highly likely in the weeks ahead. But a failed breakout or fakeout would open the door to a sharp move down to $2.70 or lower.
As with all setups, confirmation is key. Watch the triangle edges closely. The breakout window is rapidly approaching — and the market is watching.
Disclaimer: This is not financial advice. Always do your own research and assess risk before trading. Crypto is highly volatile, and past performance does not guarantee future results.
📰 XRP Price Prediction: Will $3 Hold or Break?
Disclaimer: Includes third-party opinions. No financial advice. May include sponsored content. See T&Cs.
600
0
Explore the latest crypto news
⚡️ Be a part of the latests discussions in crypto
💬 Interact with your favorite creators
👍 Enjoy content that interests you
Email / Phone number