**Introduction**
The Fantom ecosystem continues to expand with powerful new tools, and the latest addition—**Bubblemaps**—promises to revolutionise how users interact with blockchain data. By providing intuitive, visual breakdowns of token distributions, NFT collections, and whale activity, Bubblemaps brings unprecedented transparency to Fantom ($FTM) investors, traders, and developers.
Loading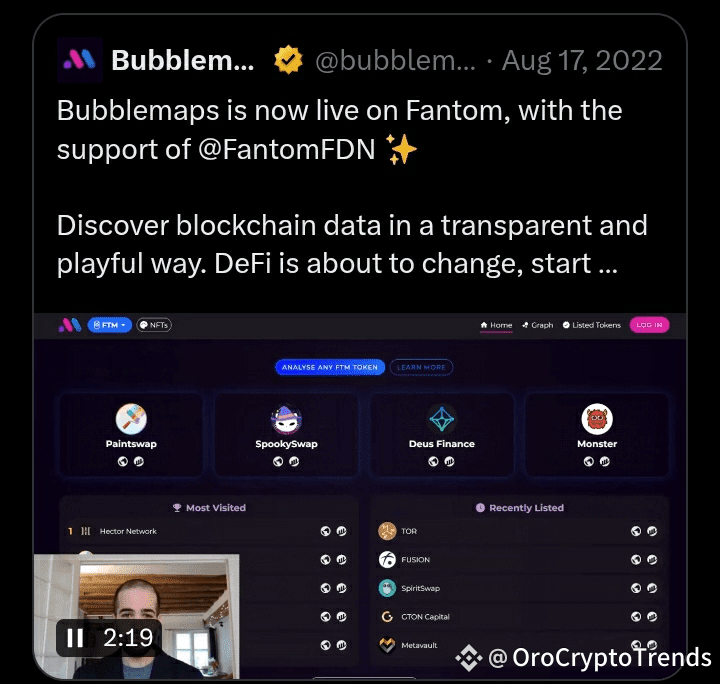
In this post, we’ll explore:
- What Bubblemaps is and why it matters for Fantom.
- Key features that make it a game-changer for on-chain analysis.
- A step-by-step guide to using Bubblemaps for $FTM and NFT insights.
- Why this integration strengthens Fantom’s position as a leading blockchain for DeFi and NFTs.
## **What is Bubblemaps?**
Bubblemaps is a **data visualisation platform** that transforms complex blockchain data into easy-to-understand interactive maps. Instead of sifting through raw transaction logs or spreadsheets, users can:
- **Track token distributions** (e.g., see concentration among top holders).
- **Analyse NFT collections** (e.g., identify rare or whale-owned assets).
- **Monitor whale movements** (e.g., detect large buy/sell trends before they impact markets).
This tool is particularly valuable for **traders, DAOs, and NFT collectors** who need real-time insights without deep technical expertise.
---
## **Why Bubblemaps + Fantom is a Big Deal**
Fantom’s high-speed, low-cost transactions have made it a hub for **DeFi, NFTs, and decentralised applications**. Bubblemaps enhances this ecosystem by:
✅ **Improving Transparency** – See exactly where $FTM tokens are held and how they move.
✅ **Enhancing Trading Strategies** – Spot whale accumulation or dumping before major price shifts.
✅ **Simplifying NFT Research** – Quickly assess rarity, ownership, and liquidity in Fantom NFT projects.
✅ **Supporting Developers** – Audit token allocations in new Fantom-based projects.
With scams and wash trading still prevalent in crypto, tools like Bubblemaps help **separate legitimate projects from risky ones**.
---
## **How to Use Bubblemaps for Fantom ($FTM & NFTs)**
Let’s walk through a practical example:
### **1. Analysing $FTM Token Distribution**
- Visit [Bubblemaps.io](https://bubblemaps.io) and search for **$FTM**.
- The interactive map shows **token concentration** (e.g., exchanges, whales, DAOs).
- Click on any "bubble" to see wallet details and transaction history.
*Pro Tip*: If a few wallets hold >20% of supply, it could signal centralisation risks.
### **2. Exploring Fantom NFT Collections**
- Search for a **Fantom NFT project** (e.g., Artion, PaintSwap collections).
- Bubblemaps displays **ownership distribution**, highlighting rare NFTs and top holders.
- Use this to gauge liquidity before buying or selling.
---
## **Comparison to Other Tools**
While platforms like **Etherscan** or **Nansen** offer similar data, Bubblemaps stands out by:
- **Prioritising visualisation** (easier for beginners).
- **Focusing on multi-chain support** (now including Fantom).
- **Providing NFT-specific insights** (rare in analytics tools).
---
## **The Future of On-Chain Analytics on Fantom**
As Fantom grows, tools like Bubblemaps will become essential for:
- **Investors** vetting new tokens.
- **Traders** spotting market trends.
- **NFT collectors** assessing project health.
This partnership underscores Fantom’s commitment to **user-friendly infrastructure**—a key factor in long-term adoption.
## **Try Bubblemaps Today**
Ready to explore Fantom’s on-chain data? Visit:
🔗 [Bubblemaps.io](https://bubblemaps.io)
*What will you analyse first? Share your thoughts in the comments!*
### **Final Thoughts**
Bubblemaps’ integration with Fantom is more than just another tool—it’s a **leap forward in blockchain transparency**. Whether you’re a trader, developer, or NFT enthusiast, this platform unlocks smarter, faster decision-making.
Stay tuned for more updates as Fantom’s ecosystem evolves! 🚀
@Bubblemaps.io
#Bubblemaps $BMT
# **Bubblemaps x Fantom: Visualizing On-Chain Data Like Never Before**
Disclaimer: Includes third-party opinions. No financial advice. May include sponsored content. See T&Cs.
1.6k
0
Explore the latest crypto news
⚡️ Be a part of the latests discussions in crypto
💬 Interact with your favorite creators
👍 Enjoy content that interests you
Email / Phone number