

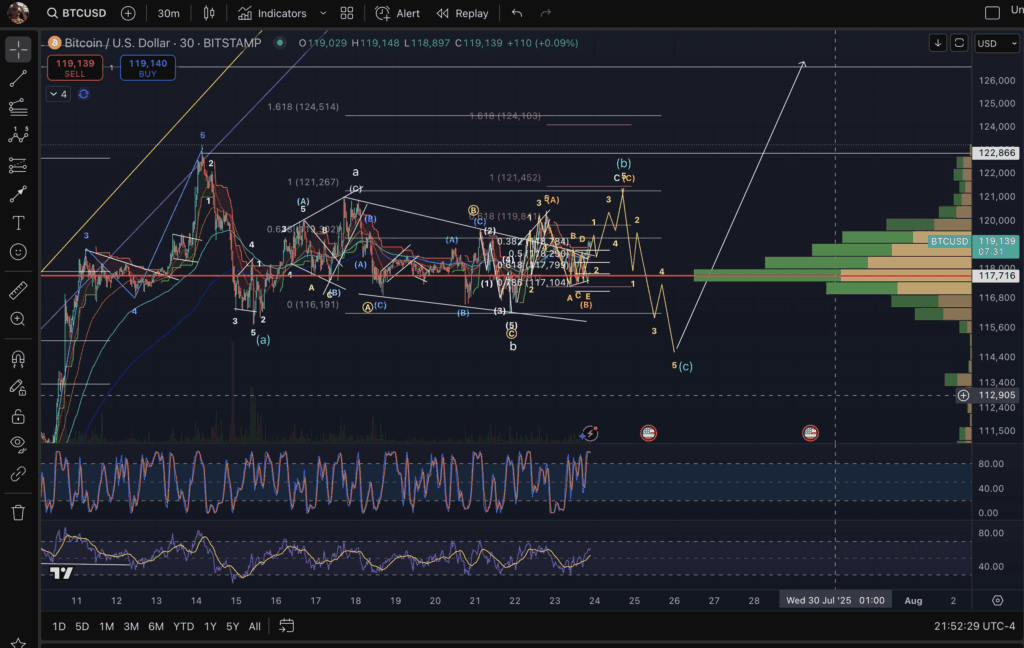
Bitcoin broke from a triangle at $119,139, but it remains in a corrective move toward $112,905 level
Volume profile suggests strong support near $117,716, and lower levels could attract buyers before new gains
The Elliott count shows a projected wave C ending near $112905 before price targets $124514 resistance zone
Bitcoin is currently trading around $119,139 on the 30-minute chart after breaking out of a triangle formation, suggesting further consolidation. A technical analysis posted by BigMike on July 24, 2025, shows that BTC has exited a non-impulsive triangle and may still be in a corrective phase. The observed breakout does not appear impulsive, pointing to a potential continuation of the correction before any clear trend resumes.
 Source: X
BTC has moved between $116,191 and $121,452 over recent sessions, with the most recent triangle formation breaking upward. However, the lack of strong momentum indicates that the structure remains corrective. Price volume analysis shows clusters near $117,716, suggesting this level remains key for short-term support.
The chart uses Elliott Wave counts and Fibonacci levels to track the ongoing market structure. BTC appears to be in a complex ABC correction pattern that has not fully played out.
Market Structure Suggests Extended Correction Before New High
The Elliott Wave labeling on the 30-minute chart shows an unfolding corrective move marked by multiple sub-waves within the ABC sequence. A peak at wave 1 formed near $121,267, followed by a significant drop back to the $116,191 area, marking wave A. This was followed by several complex retracements within wave B, eventually forming a triangle.
BigMike noted the triangle breakout but clarified that the move lacked impulsive momentum, suggesting the market has not yet completed its corrective cycle. The chart projects a potential wave C targeting a lower low near the $112,905 or $111,500 zones before any major trend reversal. Fibonacci extensions at 1.618 and 2.618 levels are plotted to support these zones.
Volume profile data shows heavier accumulation near $117,700 and $116,800. These levels may act as short-term support during the expected wave (c) drop. If BTC holds these levels, a pivot could emerge toward the upper resistance around $122,866.
Indicators Show Weak Momentum in Breakout Phase
Momentum indicators on the chart include the Stochastic RSI and a relative strength index with moving average overlays. Both indicators show multiple oversold and overbought cycles within the consolidation. The Stochastic RSI recently turned upward from the lower band, suggesting a short-term bounce.
However, the weak volume and fragmented structure of the recent move limit the potential for a strong breakout. The price movement remains tightly bound within a range, and no clear trend has emerged since the start of wave B. The non-impulsive nature of the triangle breakout adds to this uncertainty.
The upper value node on the volume profile is located at $122,866. For BTC to escape the correction fully, price must push beyond this level with strong volume. Until then, traders may remain cautious, watching the 30-minute chart for confirmation of a breakout or deeper retracement.
Will Bitcoin Complete Its Correction Before Moving to $124K?
The chart's final projection shows a possible bounce following the wave (c) dip toward $112,905. This low would complete the corrective sequence and may set up a rally targeting the 1.618 Fibonacci extension near $124,514. A bullish resolution depends on reclaiming $121,267, the peak of wave 1.
The triangle breakout has yet to demonstrate clear strength, leaving the structure open-ended. If prices revisit the $113K zone and hold, a launch toward $124K becomes technically valid.
Until then, Bitcoin continues to trade inside a wide corrective range, offering both risks and opportunities in the short term.
