

BTC dominance now sits at 53.4 percent where two trendlines and the yearly VWAP join perfectly
A break below this level could shift capital into altcoins and lead to a wider market rotation soon
A bounce from here might hold altcoin prices back as Bitcoin keeps strength over the next sessions
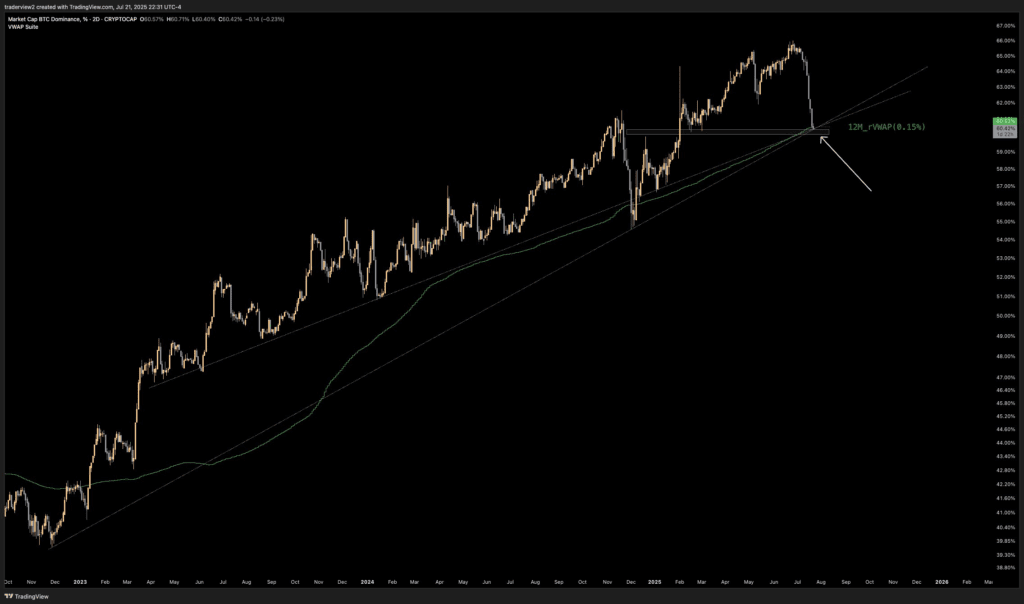
Bitcoin dominance ($BTC.D) has reached a crucial decision point at the intersection of two long-term uptrends and the yearly VWAP. According to a TradingView chart posted by analyst Dom on July 22, 2025, BTC dominance is now testing an area formed by both rising trendlines and prior horizontal support. This technical juncture holds significant weight for both Bitcoin and altcoin performance moving forward.
 Source: X
The chart illustrates a precise alignment between the 12-month anchored VWAP and historical uptrend support lines, now acting as a possible inflection point. A break below this zone may trigger a capital rotation from Bitcoin into altcoins. Conversely, a bounce could suppress altcoin upside and drive renewed BTC strength.Source:
BTC Dominance Touches Multi-Year Trend Support
The BTC dominance chart, measured on a 2-day interval, reflects a structure developed since 2023, with consistent higher lows and rising support. The dominant trendline has served as a base for nearly two years, reinforcing BTC’s weight across the crypto market. The 12-month VWAP currently rests at approximately 53.72%, adding another technical layer to this convergence point.
This level is not only a structural support but also represents a psychological zone that has previously caused major shifts in market behavior. When BTC dominance neared similar areas in mid-2023 and early 2024, altcoin cycles followed shortly after. Analysts now believe a decisive move here could realign the flow of market capital.
Dom noted that this is “an apex of two multi-year uptrends, previous support and the yearly rVWAP,” referring to the rare alignment of technical components. This confluence is drawing heightened attention from market watchers seeking clues about potential altcoin momentum.
Analyst Predicts Breakout Scenarios for Altcoin Cycles
In his post, Dom proposed two outcomes based on the direction of the breakout. He stated, “Break = Alts ballistic. Bounce = Alts get flushed.” This binary outlook suggests that the entire altcoin market hinges on BTC’s behavior at this inflection point.
If BTC dominance breaks downward, altcoins could see accelerated gains as capital rotates out of Bitcoin. Historically, dominance breakdowns have preceded major altseasons, as seen during prior years when BTC lost market share. In that case, leading altcoins may rally sharply against both BTC and USD pairs.
On the other hand, if BTC dominance rebounds, it could suppress altcoin price action. This would imply continued consolidation or drawdown across non-BTC assets. Traders monitoring this level are bracing for heightened volatility in either direction.
The scenario remains fluid, but chart watchers agree this technical zone is pivotal. Volume and sentiment metrics will likely determine which outcome prevails in the days ahead.
Market Sentiment Builds Around Apex Structure
The chart posted by Dom has accumulated over 179K views, signaling widespread attention across the crypto trading community. Traders in the comments debated both outcomes, with many awaiting confirmation before adjusting their positions. The dominance structure and VWAP confluence are among the most closely watched metrics this week.
The dominance ratio currently sits at 53.42%, just above the green VWAP support. The slope of the multi-year trendline has held firm through several corrections, including the March and May pullbacks. Its current test could mark either a failed bounce or a breakdown with broad altcoin implications.
The next few trading sessions may offer clarity on which side the breakout favors. Technical observers are aligned on one point—this level could define crypto momentum for Q3 2025 and beyond.
