
🧩 Narrative & Technical Breakdown (Post Commentary)
📅 Date: July 20, 2025
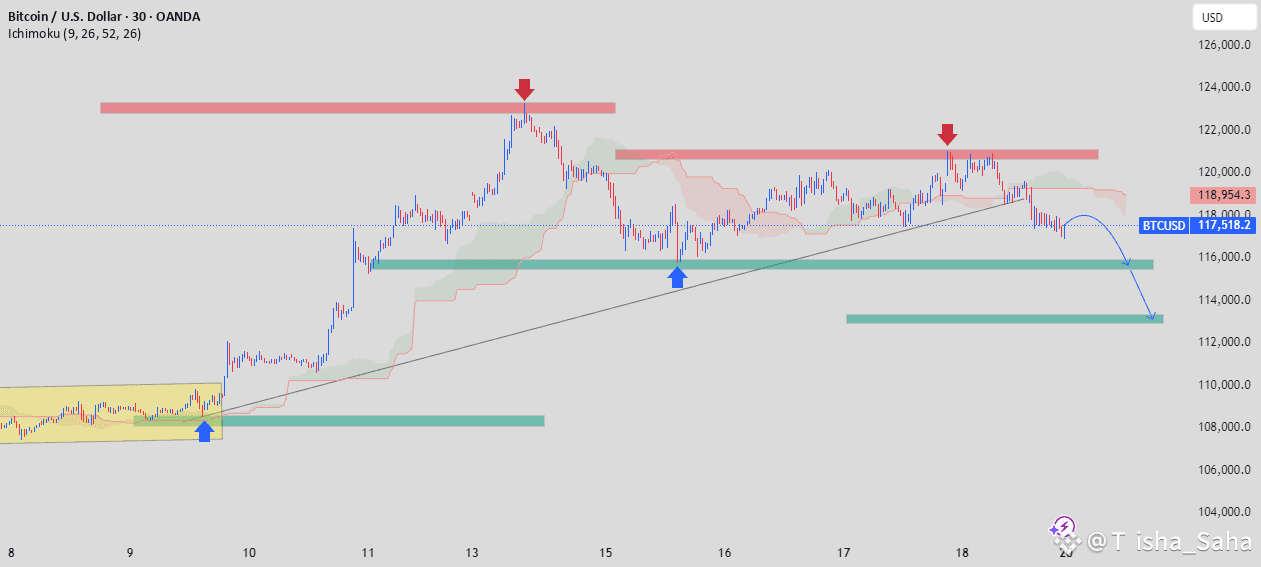
⏱ Timeframe: 30-Minute Chart
📍 Instrument: Bitcoin (BTCUSD)
---
🔍 Technical Insight & Analysis:
1. Price Structure:
Double Rejection Zone (Red Arrows) at ~$121,000–$122,000 highlights a strong resistance ceiling.
After two failed breakouts, price failed to maintain higher lows, breaking below the ascending trendline support.
2. Ichimoku Analysis:
Price is currently below the cloud, indicating bearish momentum is taking over.
Bearish Kumo twist and price rejection near the cloud further confirms weakening bullish bias.
3. Key Levels to Watch:
Immediate Support Zone: ~$116,000 (highlighted in green) — previously tested.
Major Breakdown Target: ~$113,000–$114,000 — strong demand zone and potential bounce area if the selloff continues.
4. Pattern Recognition:
Breakdown from an ascending triangle or rising wedge.
Lower highs and horizontal support breach imply a trend reversal in the short term.
---
📈 Trading Bias & Forecast:
Given the structure and momentum:
A retest of the broken trendline or the Ichimoku cloud base near $118,000 is likely, followed by a push down into the $114,000 area.
Bears are in control unless BTC reclaims $120,000 with conviction.
---
💬 Call to Action / Engagement Prompt:
> "Are we heading to $114K next? Or is this just a shakeout before another leg up? Drop your thoughts and setups below 👇 Let's chart it out together!"
---
✅ To Improve Your Chances for Editors’ Pick:
Clear Labels on Chart: Add text boxes explaining the arrows/zones (e.g., "Rejection Zone", "Breakdown Line", "Demand Zone").
#CryptoMarket4T #GENIUSAct #BinanceHODLerC #AltcoinBreakout #ETHBreakout3.5k