

XRP is priced at $3.39 with a market capitalization of $201 billion and a 24-hour trading volume of $10.74 billion. Its intraday price fluctuated between $3.36 and $3.664 per coin, marking a 7% decline from its all-time high.

XRP
On July 19, 2025, XRP’s price action across multiple timeframes reveals a critical juncture that could define its near-term trajectory. On the one-hour chart, the trend has weakened with a minor downtrend developing after a rejection near $3.664. Support has held firm at $3.34 across two tests, suggesting a short-term consolidation range. Technical indicators, such as the relative strength index (RSI) at 82.93, imply overbought conditions and hint at potential downside risk.
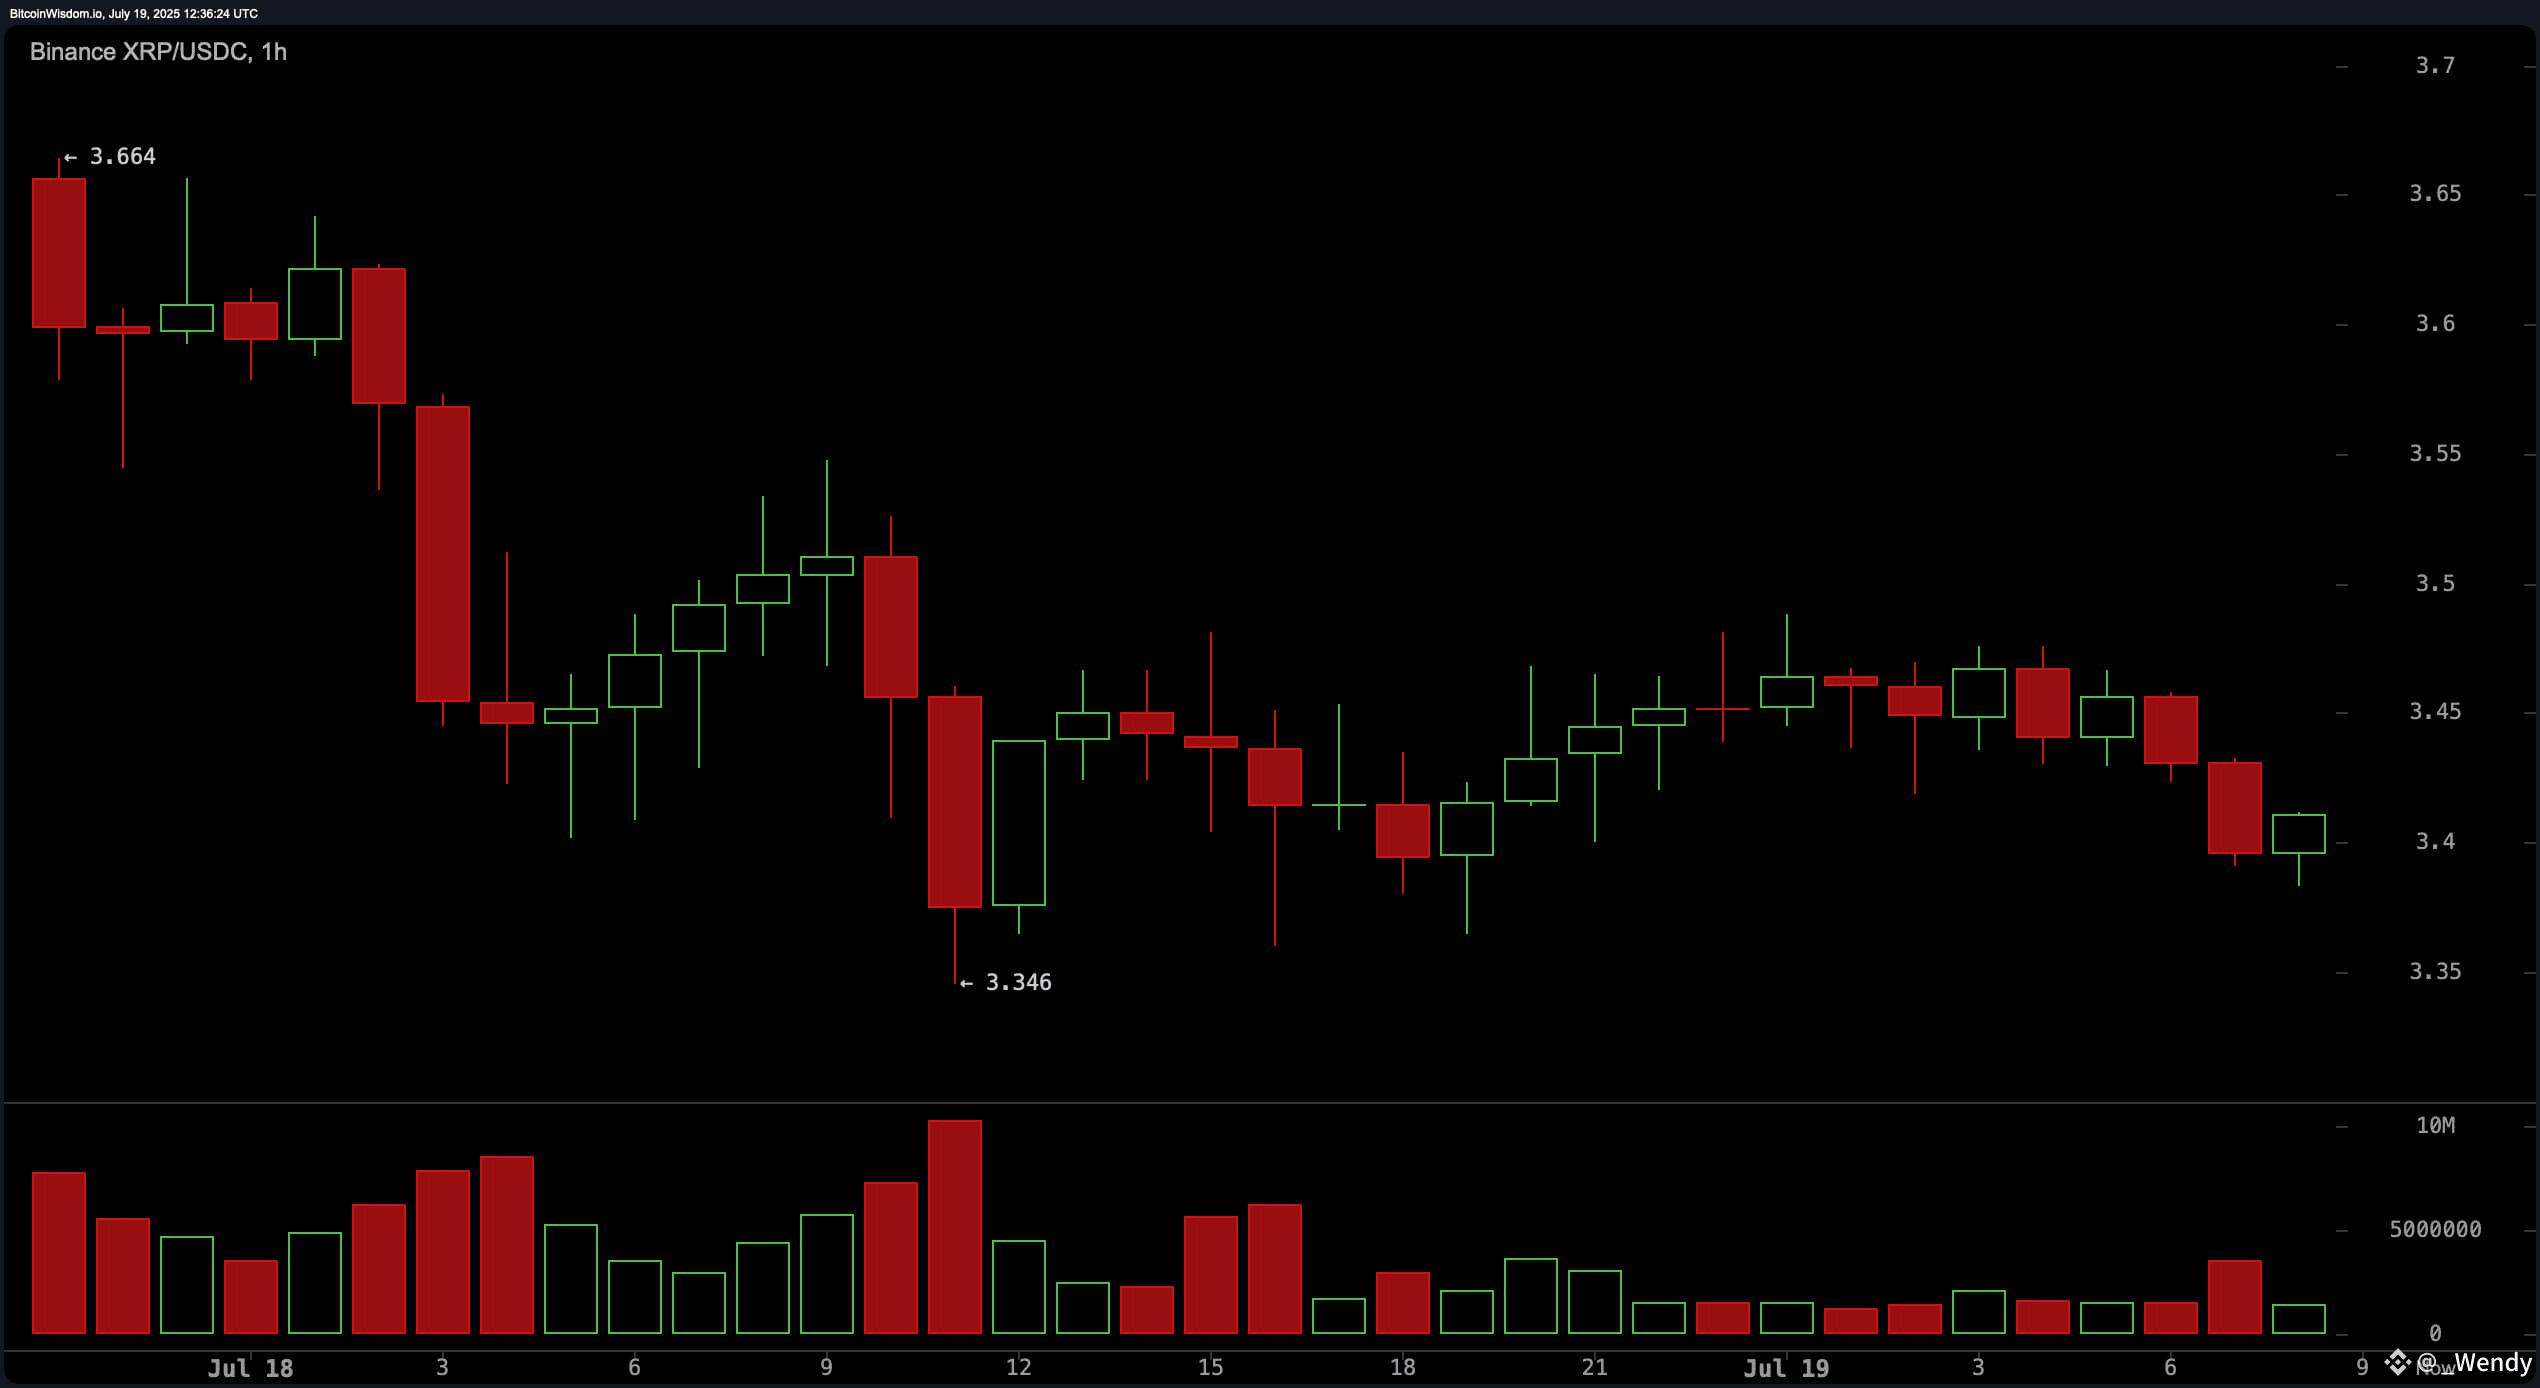
XRP/USDC via Binance on July 19, 2025. 1-hour chart.
The four-hour chart paints a clearer picture of distribution following a parabolic advance. A head-and-shoulders pattern is forming, underscored by fading volume—particularly on the right shoulder. This development aligns with weakening momentum, although the moving average convergence divergence (MACD) at 0.29587 remains in buy territory, suggesting residual bullishness. Entry opportunities may arise between $3.25 and $3.30, particularly if the relative strength index or MACD present bullish divergences. Should the $3.30 support fail, a decline to the $2.90–$3.00 zone is likely.
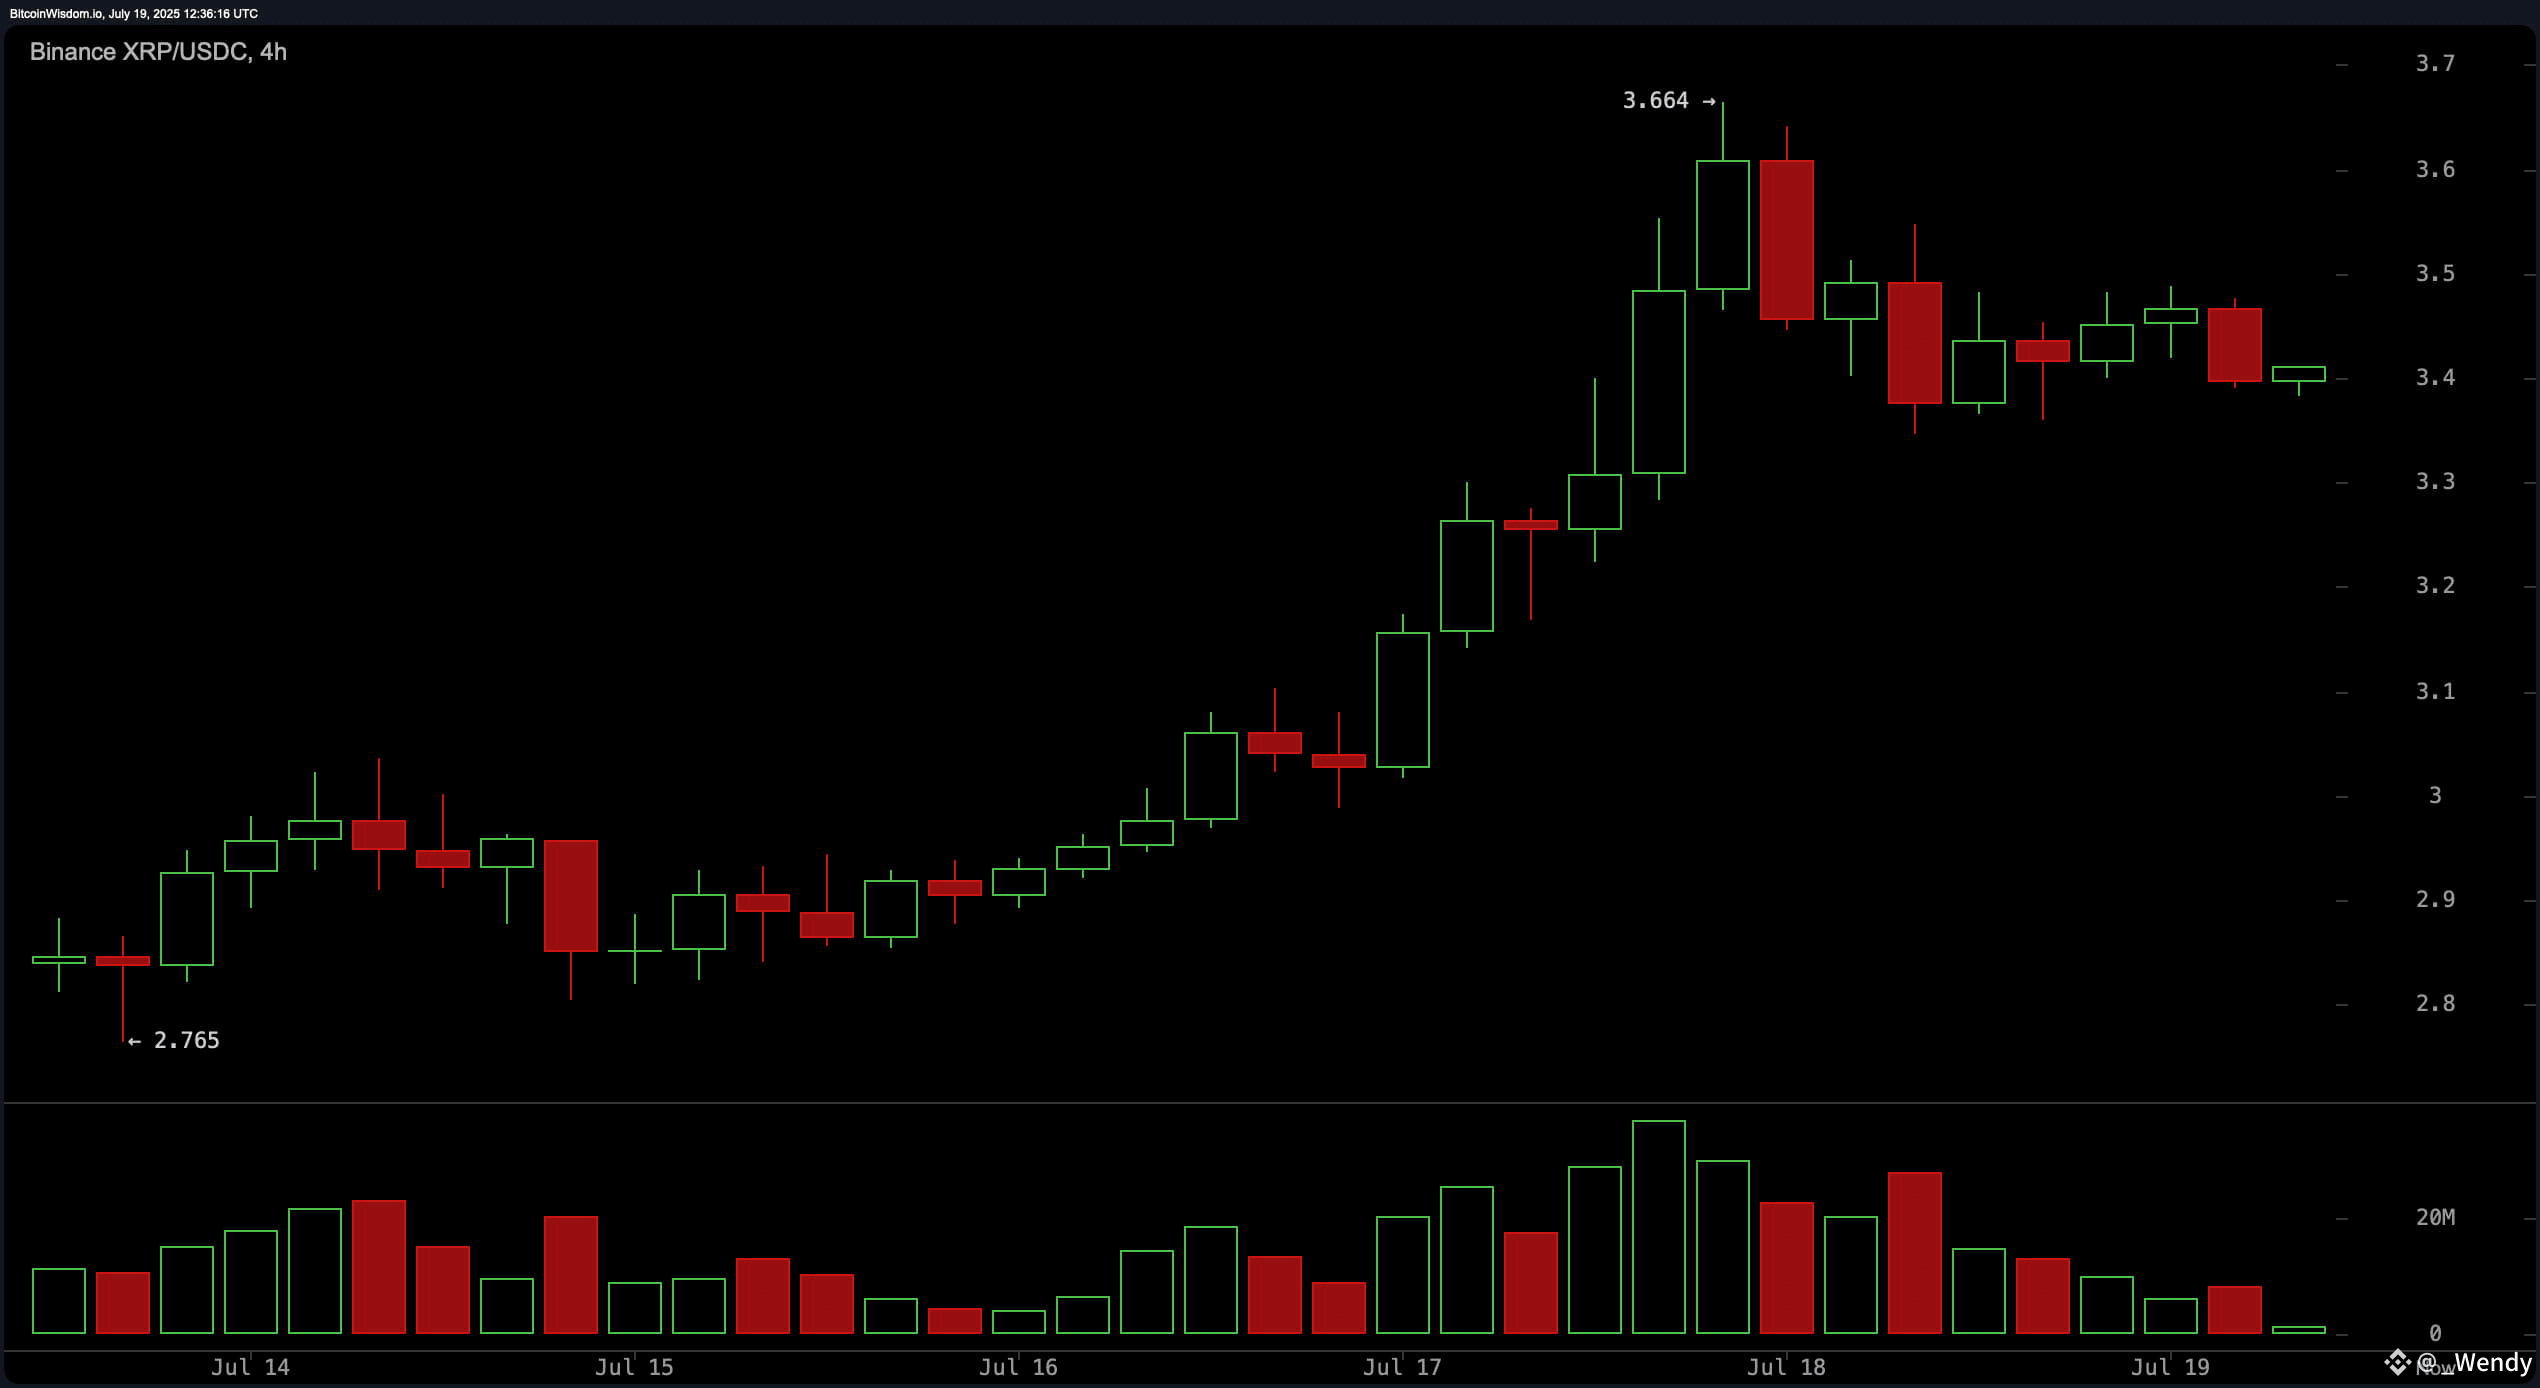
XRP/USDC via Binance on July 19, 2025. 4-hour chart.
On the daily timeframe, XRP has exhibited a strong bullish breakout from approximately $1.90 to $3.66. However, a sequence of candlesticks with long upper wicks and red bodies near recent highs signals exhaustion. A doji or spinning top in this context often precedes a reversal or a pause. The average directional index (ADX) at 46.29 suggests a strong trend, but overextension is evident across multiple indicators. Traders should monitor for a retracement into the $3.20–$3.30 region to confirm a healthier continuation pattern before re-entering.
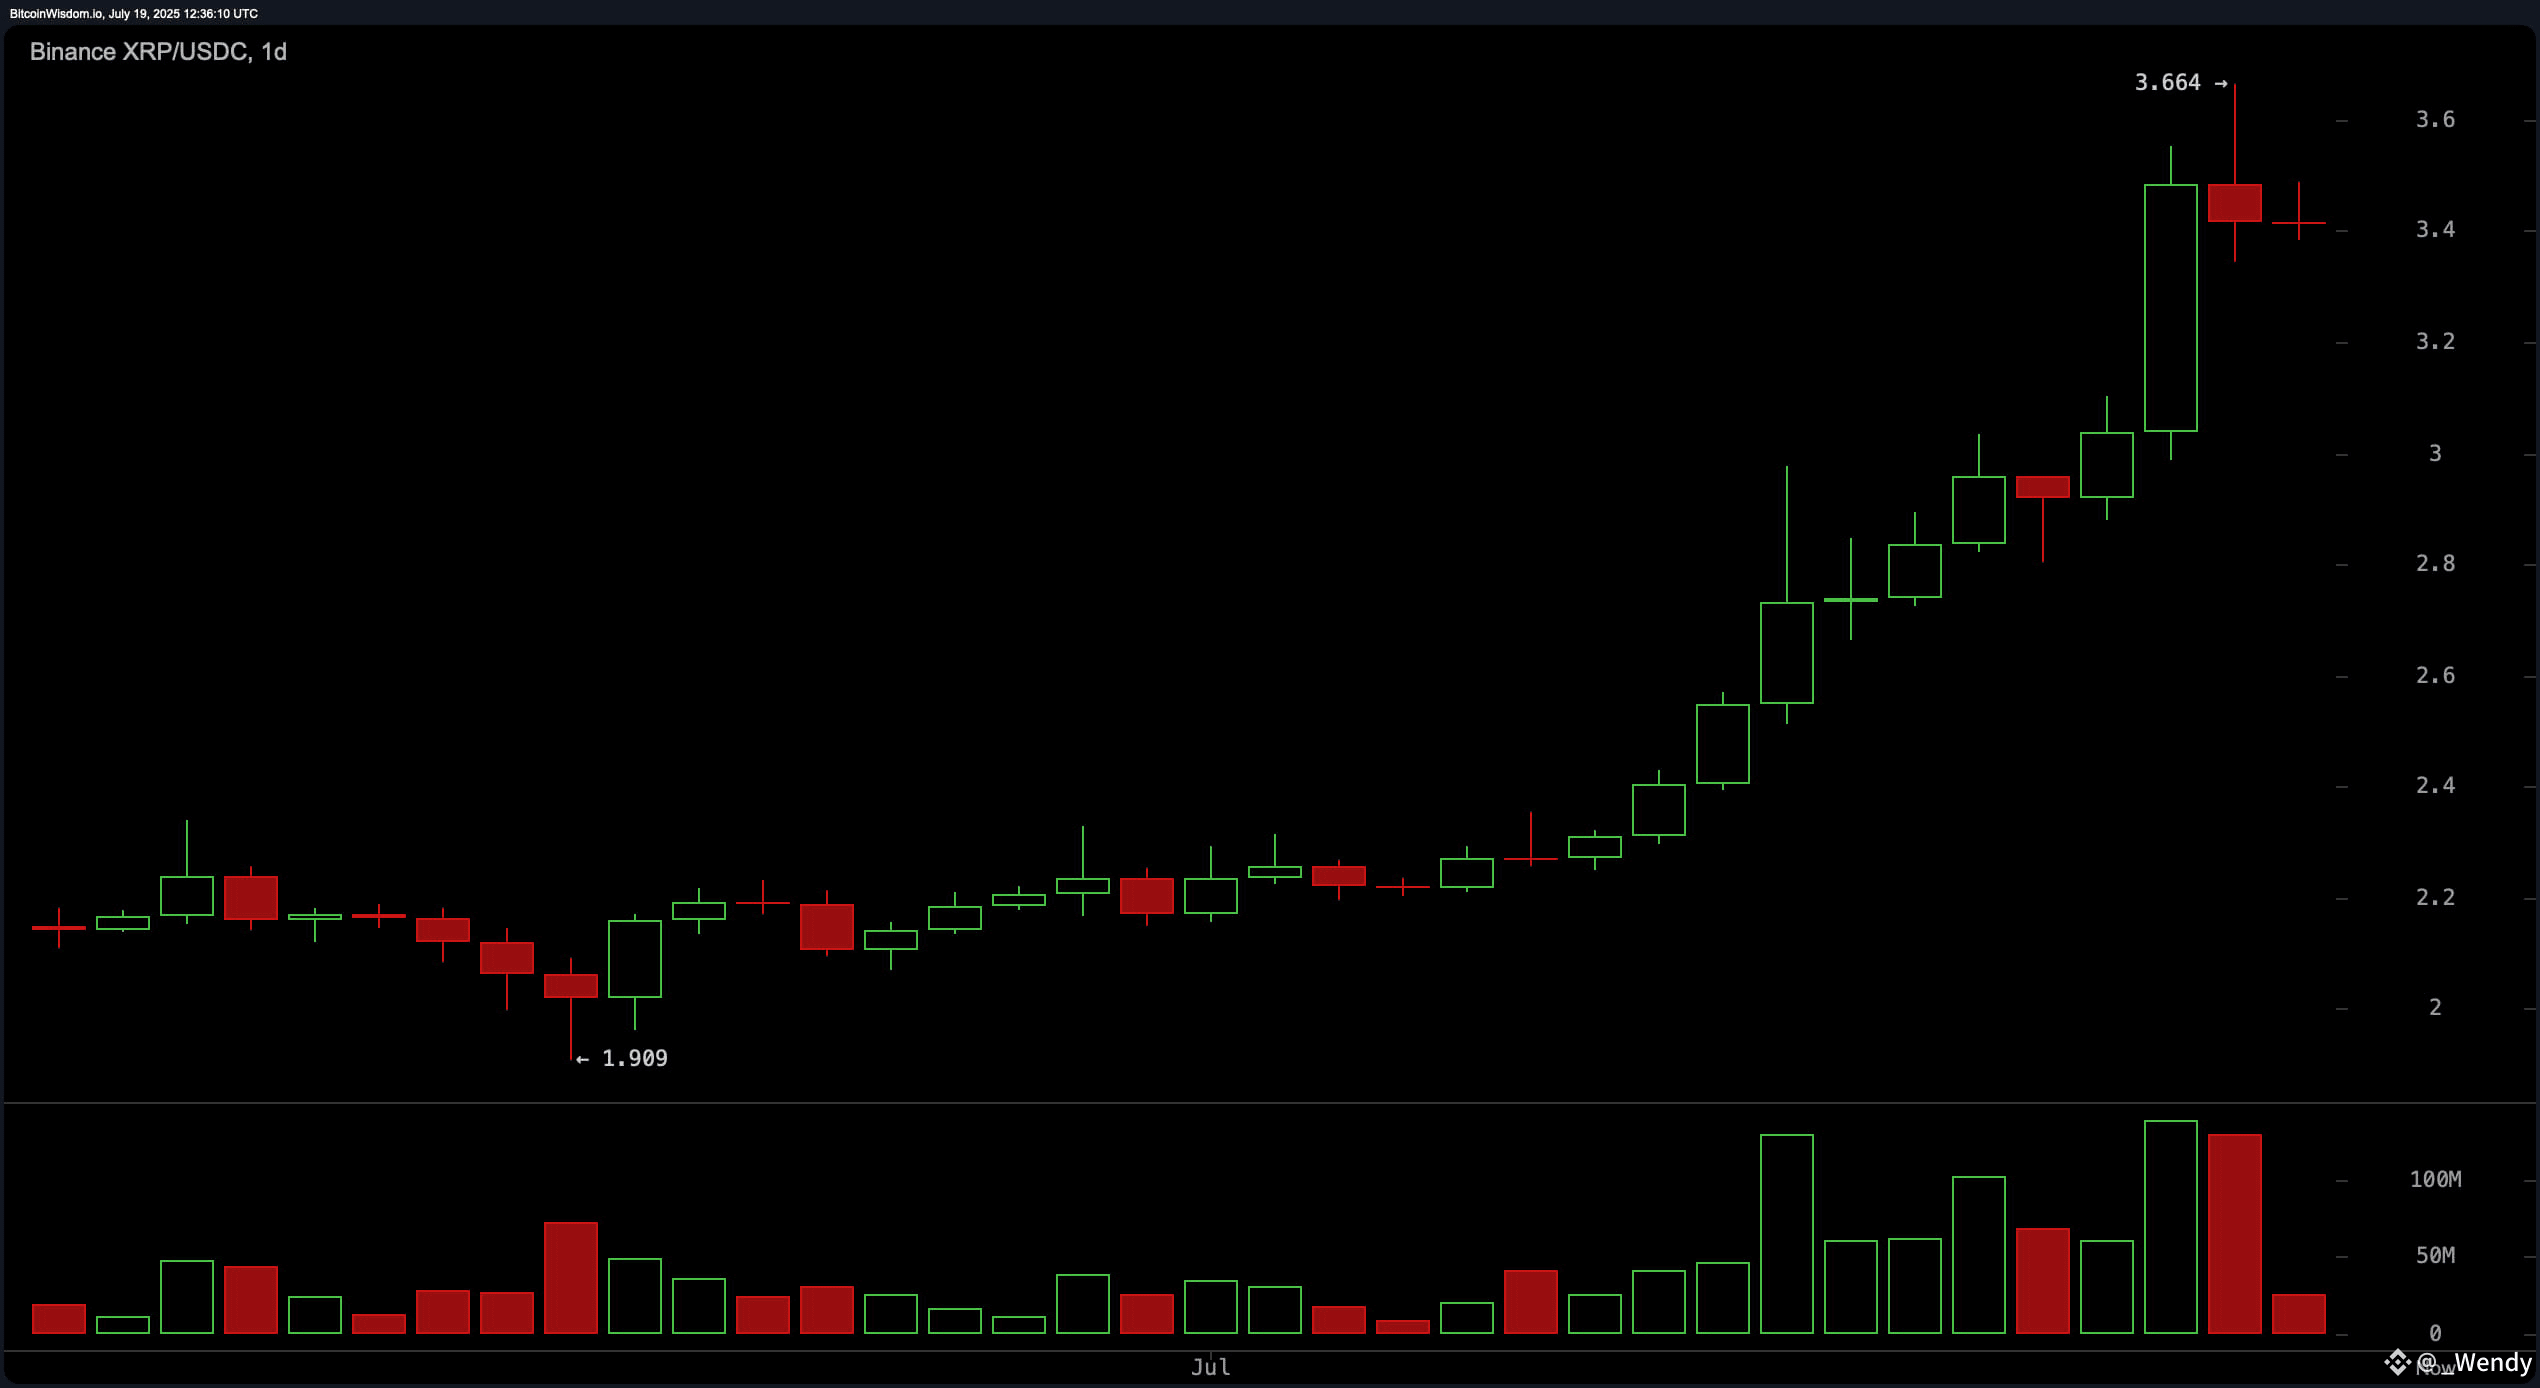
XRP/USDC via Binance on July 19, 2025. Daily chart.
XRP’s oscillators provide mixed signals that reinforce the current uncertainty. The commodity channel index (CCI) at 141.57 and momentum (10) at 1.00023 both signal potential overextension, with corresponding bearish signs. In contrast, the MACD offers a bullish signal, while the Stochastic oscillator remains neutral at 86.67. This divergence highlights the need for confirmation before engaging in aggressive positioning. Conservative traders may prefer to await a clear reversal signal before committing capital.
Moving averages (MAs) across all durations are notably aligned in bullish formation. Both the exponential moving averages (EMAs) and simple moving averages (SMAs) from the 10-period to the 200-period are issuing positive signals. This configuration supports a longer-term bullish outlook, provided short-term support zones hold. A break below key support levels could challenge this outlook and invite a deeper correction. The confluence of trend exhaustion, oscillator divergence, and robust moving averages signals a pivotal moment for XRP’s price direction.
Bull Verdict:
If XRP maintains its support above $3.30 and confirms a bullish reversal in the $3.20–$3.30 range, the uptrend remains intact. With all major moving averages signaling strength and the MACD still in positive territory, a renewed push toward and potentially beyond $3.66 is plausible in the coming sessions.
Bear Verdict:
A decisive break below the $3.30 support zone, especially on rising volume, could validate the developing bearish patterns on lower timeframes. Combined with overbought oscillator readings and fading momentum, this scenario opens the door for a retracement toward $3.00 or even the $2.90 region before any meaningful recovery.
