
ETH/USD 30Min Chart Analysis 🧠📊
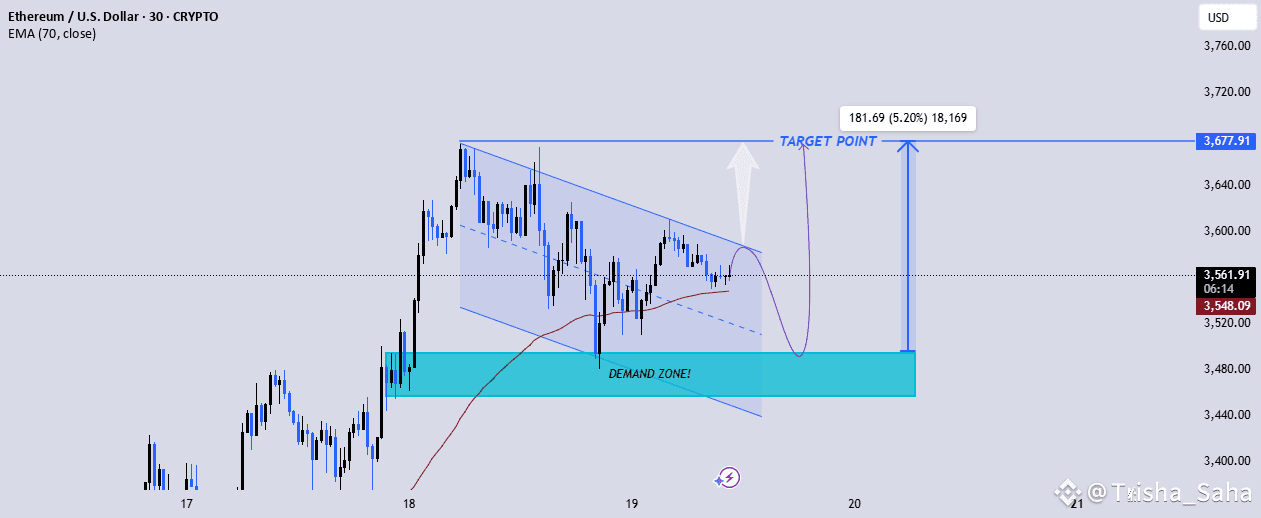
🔹 Pattern: Descending wedge – a bullish reversal pattern.
🔹 EMA Strategy: Price is hovering near the 70 EMA (3,548.11), acting as dynamic support.
🔹 Demand Zone: Strong support zone around 3,470–3,490, previously respected by buyers.
🔹 Price Action: Consolidation with lower highs & higher lows signals compression before breakout.
🔹 Volume Strategy: Low during consolidation, expected surge on breakout.
🔹 Target: Projected breakout to 3,677.91 (+5.2%) if price respects demand and breaks wedge.
✅ Strategy Suggestion:
Buy setup: If price retests demand zone & forms bullish candle → target 3,677
Confirmation: Breakout above wedge & EMA with strong volume
📈 Bullish bias while price holds above demand zone and 70 EMA
❗Watch for false breakout traps near wedge resistance
#CryptoMarket4T #GENIUSAct #BinanceHODLerC #AltcoinBreakout #ETHBreakout3.5k