
Bitcoin is currently undergoing a measured pullback after its recent push toward $121K. On the 1H timeframe, price has tested the 200 EMA and held so far, forming a short-term support near $117K. This aligns with a prior consolidation area and is showing some early signs of bottoming.
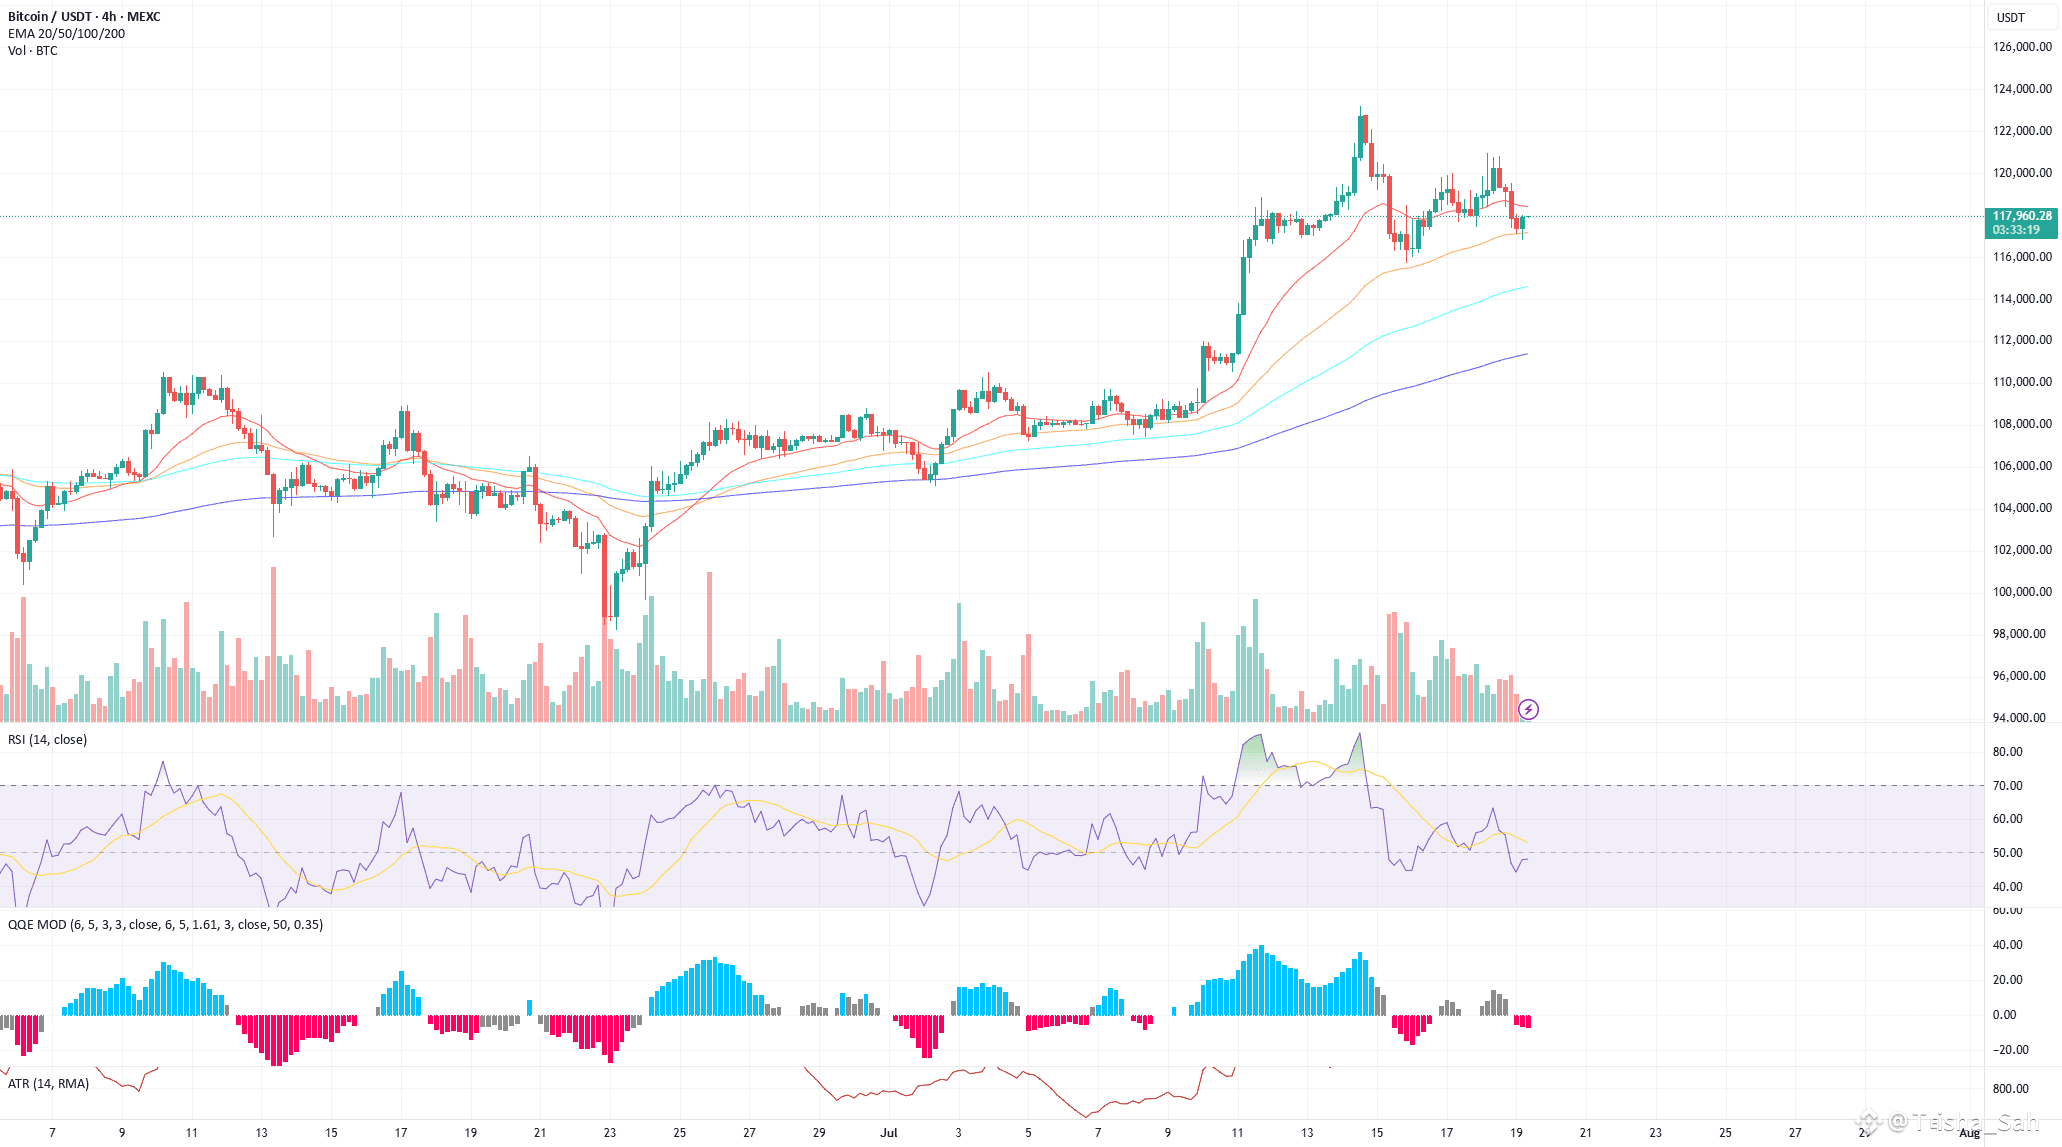
On the 4H chart, price is also consolidating after a healthy run-up. While momentum has cooled, BTC remains above key moving averages. RSI is approaching mid-range levels (~48), and the QQE is lightly bearish but not aggressive.
Key Zones to Watch:
Support (1H + 4H confluence):
🔹 $117,000 – $117,300 (EMA 200 + historical pivot + bounce region)
Resistance/Breakout Target:
🔹 $118,500 – $119,500 → Area where shorter EMAs are clustered
🔹 $121,000 → Previous local high
Take Profit (if bounce plays out):
🔹 TP1: $119,200
🔹 TP2: $120,800
🔹 TP3: $122,800
Scenarios:
Bullish Bias (if price reclaims $118.5K+):
Reclaiming EMAs and printing higher lows would suggest continuation.
RSI crossing 50 and increasing volume would confirm short-term bullish momentum.
Bearish Bias (if $117K breaks):
Breakdown from this base could send BTC to test $116K or even back to $114.5K range.
Look for volume spike + MACD/QQE confirmation for further downside.
Summary:
BTC remains in a constructive uptrend on higher timeframes. The current pullback is still within normal range, especially while price respects the 200 EMA on both 1H and 4H charts. This is a key decision zone—bulls want to see a reclaim of $118.5K, while bears need to break below $117K to take control.
#GENIUSAct #BinanceHODLerC #AltcoinBreakout #ETHBreakout3.5k #BinanceHODLerERA