Ripple XRP price has been on a tear, breaking through key resistance levels and grabbing the attention of traders everywhere. After smashing past the $3.18 Fibonacci extension, analyst CasiTrades pointed out on X that the move came with more strength than expected.
Instead of slowing down, XRP kept climbing and is now getting close to its previous all-time high of around $3.40. If this momentum keeps up, it could push the asset into price discovery territory.
At writing, XRP is trading near $3.25 after briefly tagging the 0.618 Fibonacci extension at $3.27. It’s currently pulling back a bit, but holding steady above the breakout zone. CasiTrades called this a clean back-test of both the breakout level and the ascending channel, noting that the retrace so far looks shallow and well under control.
XRP Price Breakout Clears Key Resistance Levels
XRP didn’t slow down after clearing the 0.382 Fib level at $3.18, it powered straight up to $3.27, hitting the 0.618 extension.
That move pushed it into the upper half of its upward channel, showing real strength on the lower timeframes. Since then, the XRP price has pulled back a bit and is now retesting the $3.18 zone, which has flipped into short-term support.
The move above $3.18 was described by CasiTrades as “acceleration, not exhaustion.” This comment reflects the ongoing strength of the current wave. If XRP price maintains this structure, a test of $3.40 appears likely in the near term.
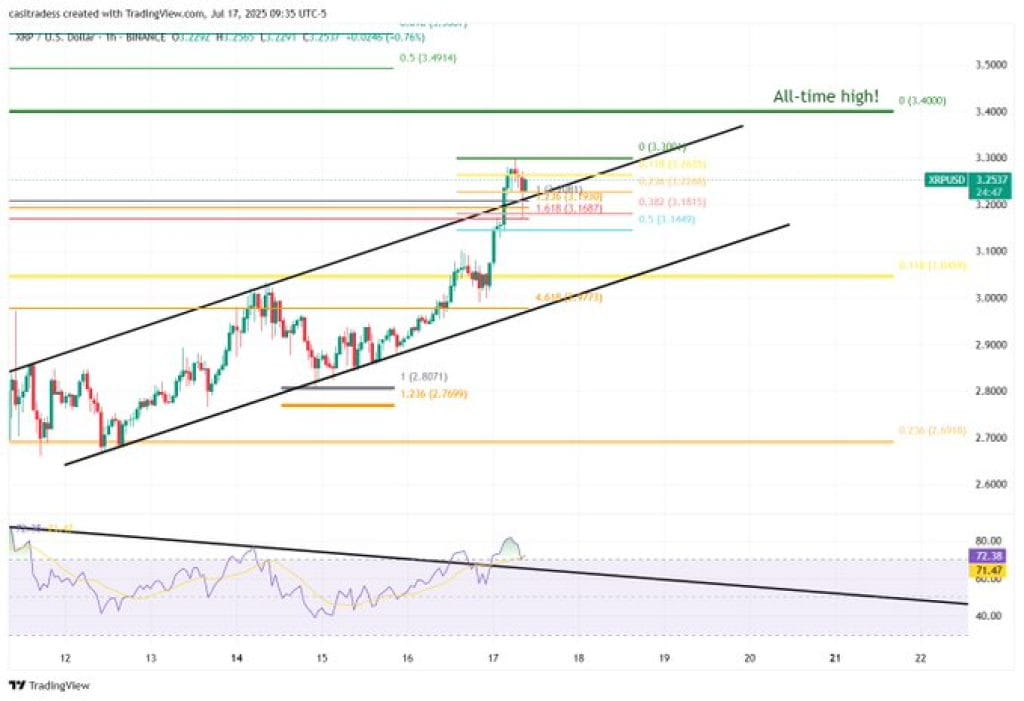 Image Source: X/CasiTrades All Eyes on $3.40 as Market Targets XRP Price Discovery
According to the analysis, $3.40 represents a major barrier and marks the asset’s previous all-time high. A breakout above this level would shift XRP into uncharted territory. CasiTrades referred to this breakout level as the gateway to macro wave 3, a phase associated with rapid expansion and volatility.
Above $3.40, projected resistance levels widen considerably.Targets to keep an eye out for in the future are $4.62, $6.50, $9.50, and $12.50.
These are derived from higher Fibonacci levels and are possible targets if the trend continues. However, the analyst noted that each of these zones may require back-tests once reached.
Read Also: 5 Real Reasons to Buy BONK Before It Flips Pump.fun
Furthermore, even momentum indicators support the bull story. The relative strength index (RSI) remains above 70, and the chart shows XRP price has broken out of a downtrending RSI line. This breakout confirms that the current rally is not yet showing signs of exhaustion on the indicator.
The RSI holding above this trendline signals strong buyer interest, with no bearish divergence observed at the time of analysis. This supports the idea that the pullback toward $3.18 is part of a consolidation phase, not a trend reversal.
XRP Price Short-Term Structure Remains Intact
XRP remains within the boundaries of a well-defined ascending channel. Support is visible at $3.18 and along the lower trendline.
Resistance now lies at $3.27 and $3.40. A clean close above $3.40 would confirm breakout conditions and open the door for extended upside movement.
For now, the structure shows continued strength. As long as XRP price holds its current channel, momentum favors buyers heading into the next test at the all-time high.
Subscribe to our YouTube channel for daily crypto updates, market insights, and expert analysis.
The post XRP Price Surges Past Expectations – Can It Smash Through All-Time Highs Next? appeared first on CaptainAltcoin.

