
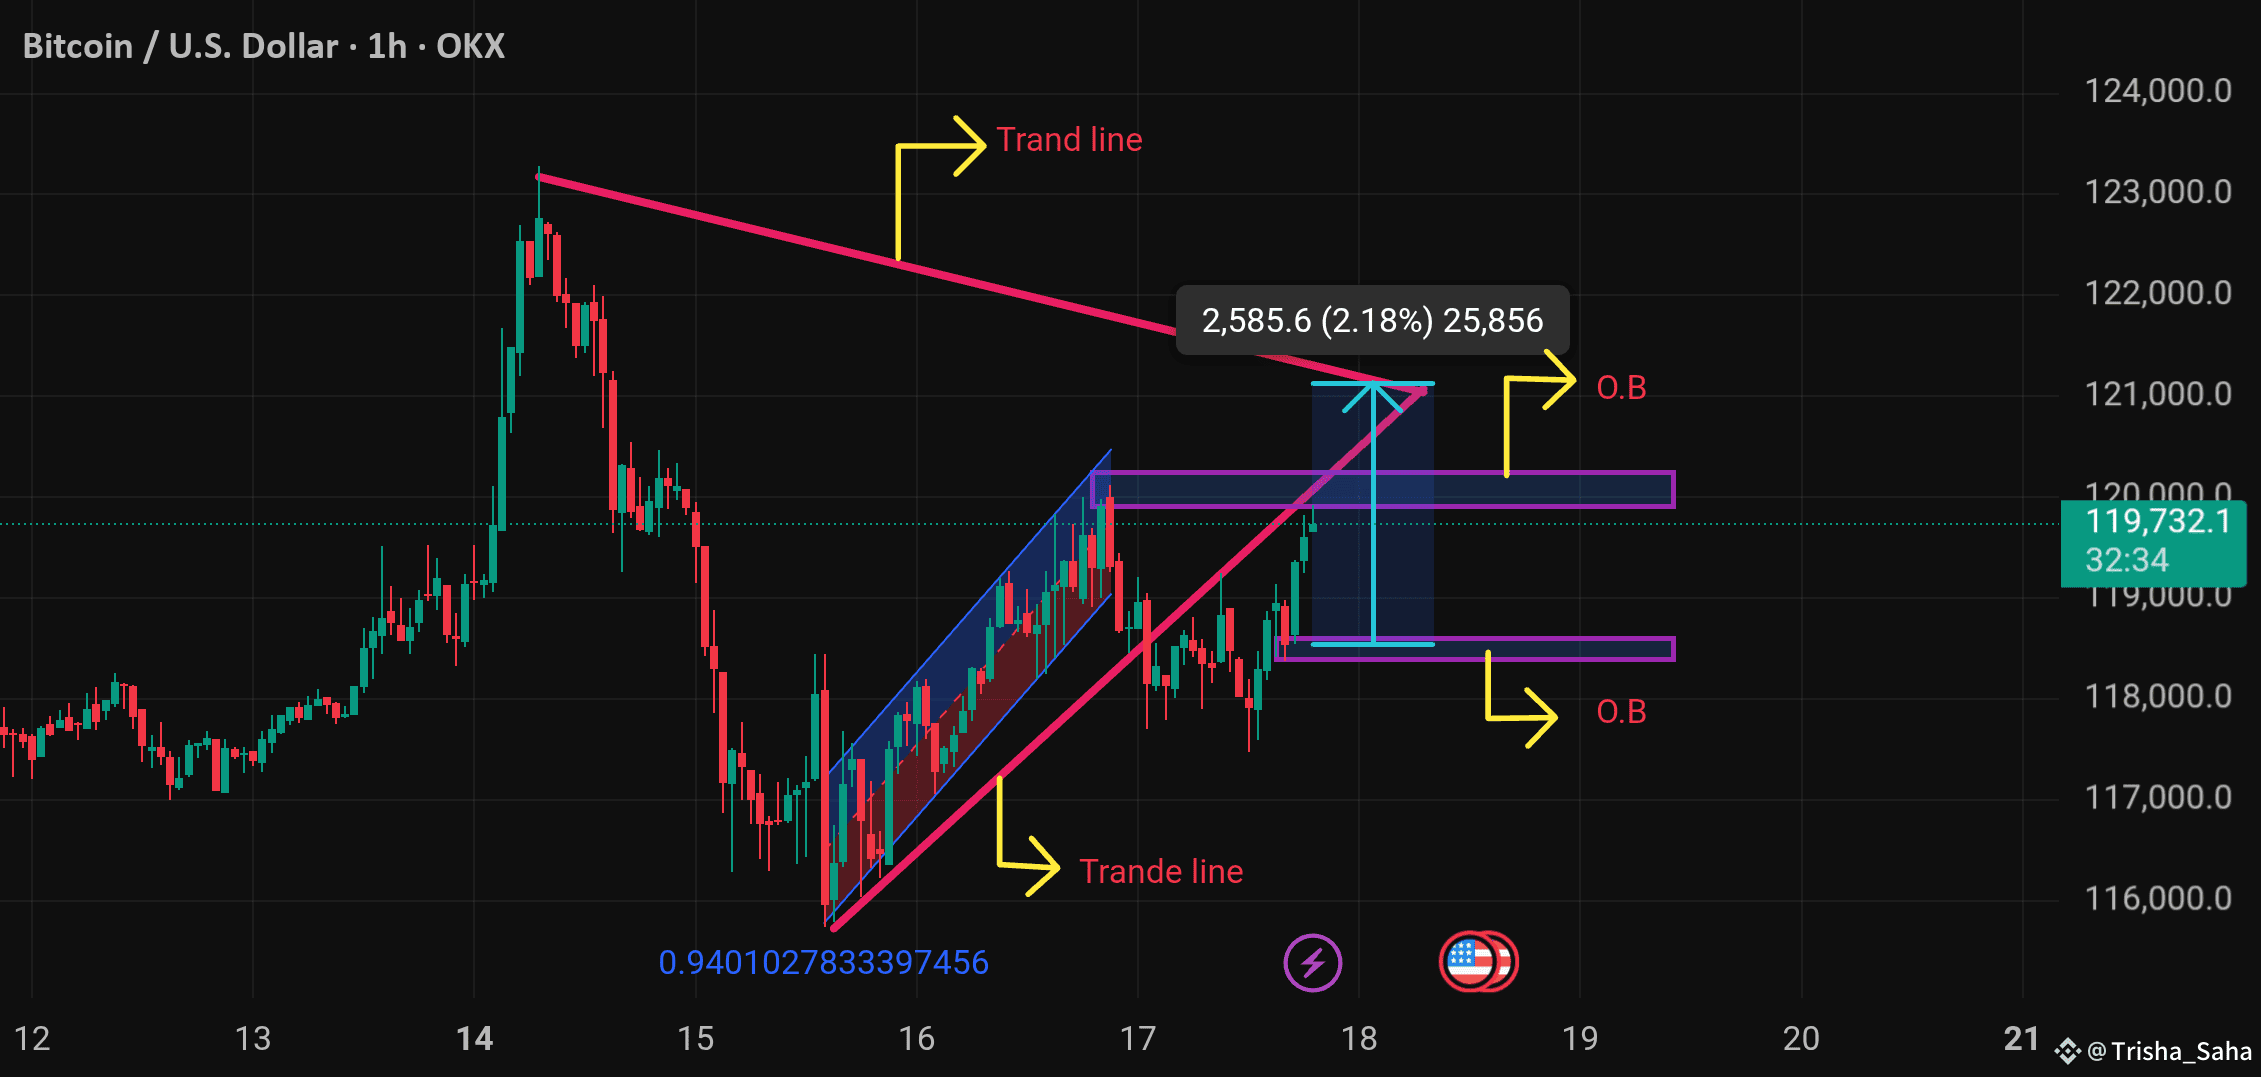
The chart shows a BTC/USD (Bitcoin vs. US Dollar) technical analysis on the 1-hour timeframe. Here's a detailed breakdown:
---
🔍 Chart Elements & Interpretation:
1. Trend Lines:
Upper Pink Trend Line: Acts as a resistance from a previous high.
Lower Pink Trend Line: Represents a support line from the recent upward trend.
Blue Channel: Shows a rising wedge or ascending channel (often a bearish reversal pattern).
2. O.B (Order Blocks):
Upper O.B Zone (~120,000–121,000): Potential supply zone or area of resistance.
Lower O.B Zone (~117,500–118,500): Possible demand zone or support.
3. Price Projection:
A measured move of 2,585.6 points (2.18%) is marked upward from the current breakout attempt.
4. Current Price:
BTC is trading at $119,771.8, with a +0.90% increase at the time of this chart.
---
🧠 Technical Outlook:
Bullish Case:
Breakout above the upper trend line and clearing the upper O.B could lead to a continuation toward 122,000+.
If BTC respects the demand zone and bounces, the uptrend may resume.
Bearish Case:
Failure to break above resistance or rejection at
#BinanceHODLerERA #PowellVsTrump #AltcoinSeasonLoading #BTCWhaleTracker #BTC120kVs125kToday