
Weekly timeframe for Ethereum (ETH/USD)), here’s the technical analysis and key bullish projection:
🔷 Key Observations:
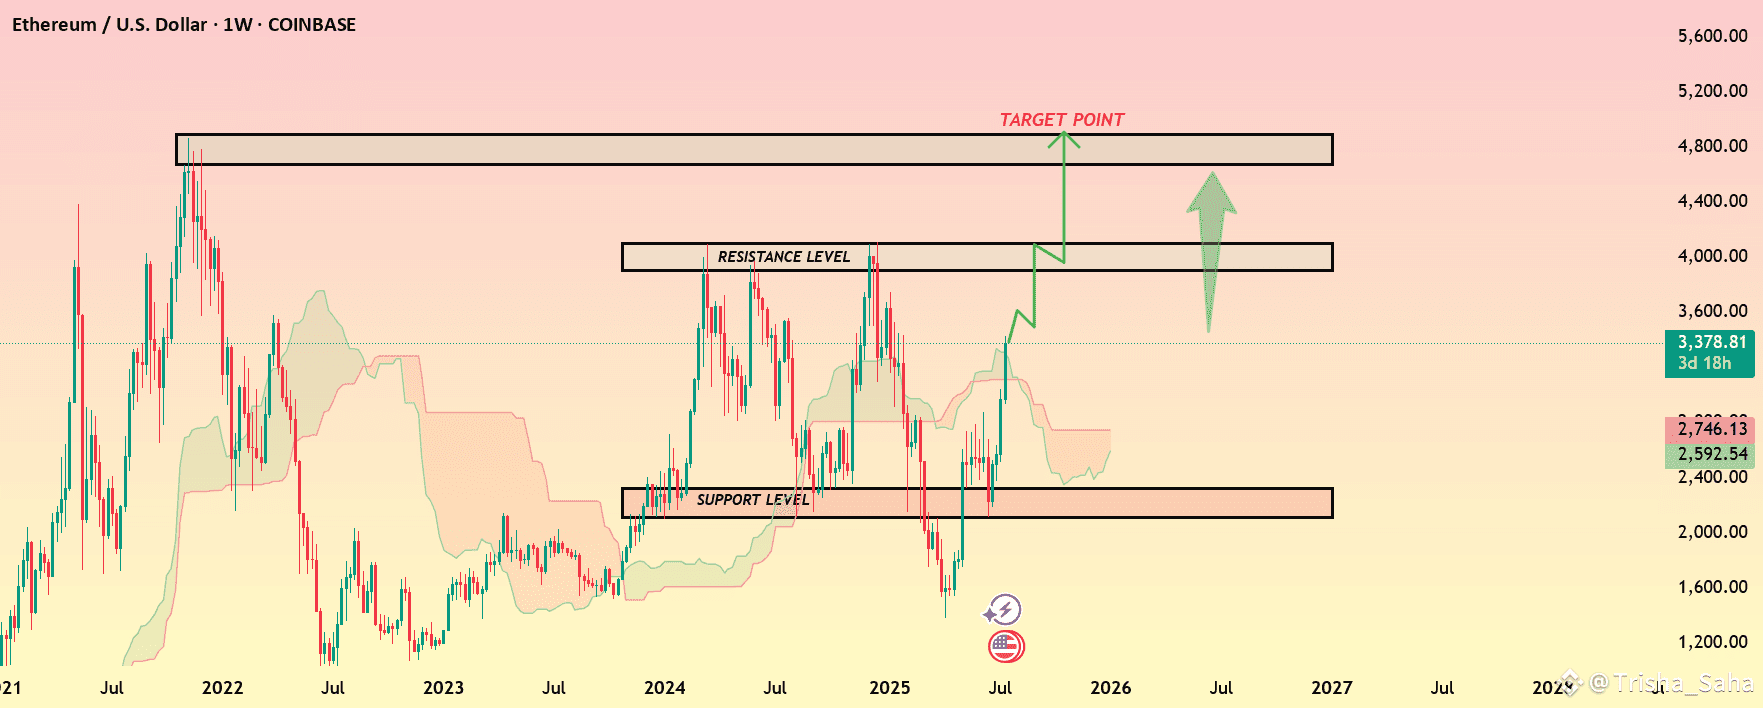
Price has strongly bounced from a major support zone near the $2,400–$2,600 level.
Ethereum is now pushing toward the next resistance zone, previously tested around $3,600–$3,800.
The Ichimoku Cloud has turned bullish, with price breaking and holding above the cloud structure.
If ETH successfully breaks above the $3,800 resistance, it opens the door to a larger upside move.
A clear target point is drawn on the chart, suggesting where price may head in the coming months.
🎯 Target Levels (as shown on chart):
1. Immediate Resistance Zone: Around $3,800–$4,000
Key level where previous rallies have faced rejection.
Watch for breakout confirmation.
2. Target Zone: Around $4,800–$5,200
If breakout holds, price could rally into this major resistance area.
This zone aligns with historical highs and Fibonacci extension levels.
📈 Conclusion:
ETH/USD is showing a strong bullish continuation pattern. A confirmed breakout above $3,800 could lead to a larger move toward $5,000+, supported by momentum and weekly Ichimoku trend confirmation.
#BinanceHODLerERA #AltcoinSeasonLoading #BTCWhaleTracker #BTC120kVs125kToday #USCryptoWeek