
Given the daily network volume, XRP is no longer a member of the billion XRP club. A significant on-chain volume helped the asset's price quickly recover, but as whales retreat, it may be over. No matter how much resistance sellers put up, XRP has also demonstrated that it is not prepared to give up on breaking through the $3 psychological barrier.
Surprisingly resilient and persistent, the asset has refused to reverse significantly after failing to push past $3.02 in last week's explosive breakout, instead consolidating just below the milestone level. Because of the size of the move, the chart's structure is as bullish as it gets. All of the major moving averages are still far above XRP's current price action, while the 200-day EMA and the 50-day EMA are far below.
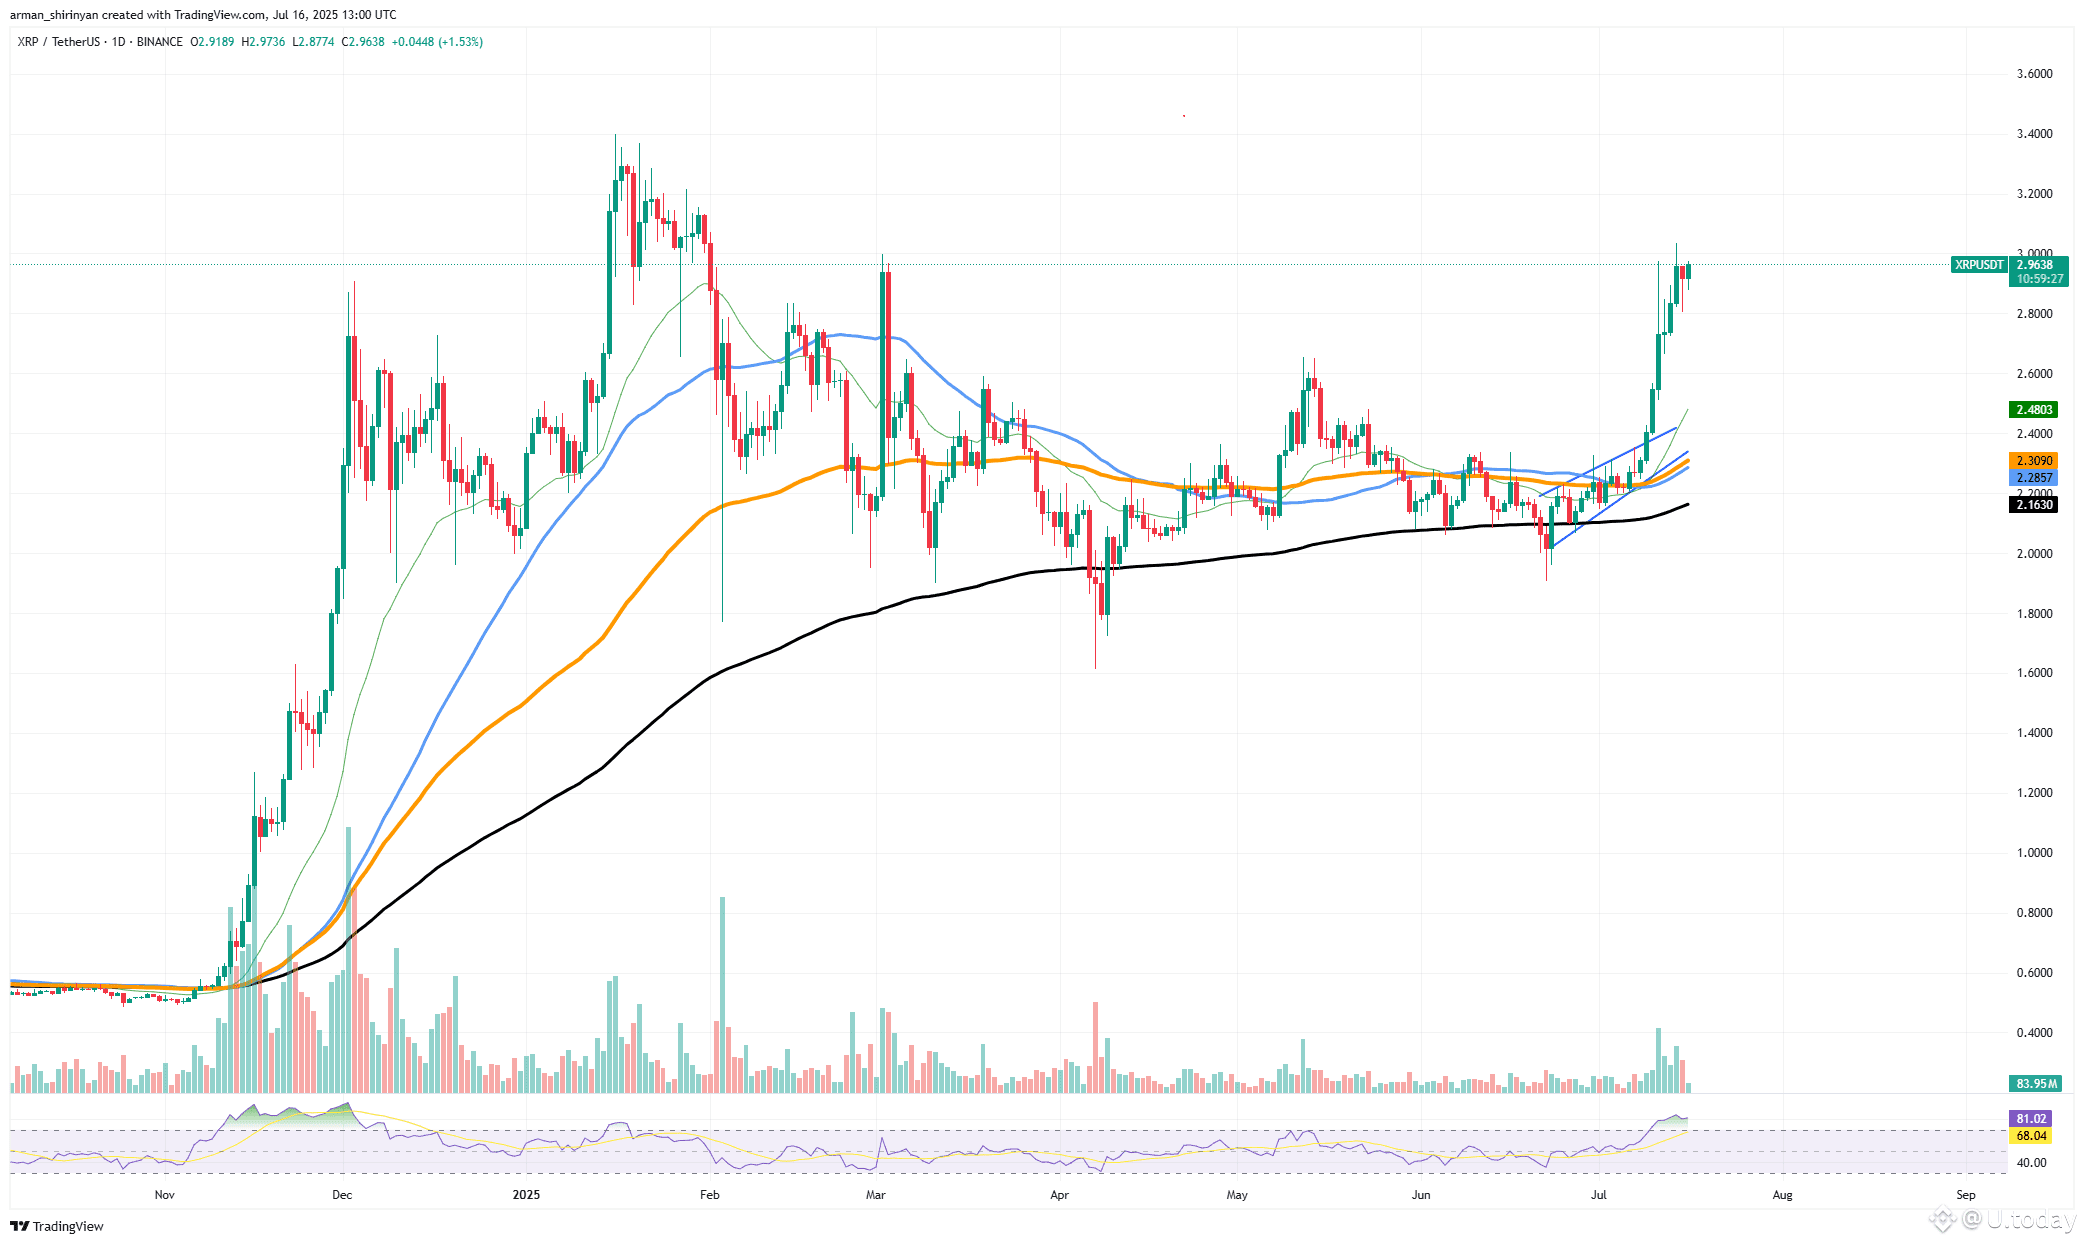
Despite temporary profit-taking, the market is still clearly skewed in favor of the bulls, as evidenced by the large discrepancy between spot price and trend indicators. Despite a slight slowdown from the initial spike, volume is still high when compared to previous months, indicating that participation has not decreased.
The RSI, which is circling 80, is even more telling. There was a brief decline to the mid-$2.80s following the previous attempt to break $3, which was met with predictable selling at $3.02. Instead of collapsing, however, XRP immediately returned to the $2.90 range, where it has remained for a number of sessions. This pattern clearly indicates that buyers are taking advantage of every slight decline as a chance to enter the market.
Next steps: if XRP successfully breaks and hold above $3.02, it may lead to a fresh round of momentum-driven buying that drives the price closer to the next resistance level, which is around $3.30. On the down side, any retrace that remains above $2.70 ought to be regarded as a sound reset rather than the beginning of a reversal.
Ethereum feels better
Ethereum has successfully breached the psychological $3,000 mark, and compared to the previous unsuccessful breakout attempt in May, this move appears much more likely. After rallying into resistance close to the 200-day EMA at that time, ETH was slammed back into a consolidation range. The asset has surpassed all of the major moving averages, including the 200-day EMA at $2,600, and is clearly gaining momentum according to today's chart, which presents a completely different picture.
The fact that both volume and price have increased is crucial evidence that this rally is more than just speculative chop. Over the past week, every daily candle has closed higher than the one before it, indicating buyers' unwavering commitment. Even though the RSI is getting close to overbought territory above 77, it shows how strong the breakout has become rather than indicating exhaustion.
card
When the price keeps grinding higher and the RSI stays high, this usually indicates long-term accumulation rather than speculative activity. Between now and the $4,000 zone, Ethereum faces comparatively little structural resistance.
Concurrent with the pre-crash support area from late 2024, this marks the next significant psychological milestone. In the upcoming weeks, a test of that level is likely if ETH keeps up its momentum. Naturally, traders should continue to be mindful of the possibility of temporary declines.
It would be shocking if the breakout area around $3,000 were to be retested, as the rally has now extended significantly from the 50-day EMA near $2,700. But the overall trend is still firmly bullish as long as the price stays above that range. To put it succinctly, Ethereum's most recent spike represents the asset's strongest upward movement in months. Now that sentiment volume and momentum are all in line, the $4,000 target is easily within reach.
Bitcoin needs help
Due to conflicting signals from Bitcoin's recent price action, the cryptocurrency king could be in trouble. Following a spectacular breakout above $120,000, Bitcoin reached as high as $125,000 before an enormous volume spike nearly instantly turned the tide.
The outcome was a steep decline back below $120,000, where it is currently trading at about $118,900. The dynamic can be seen clearly on the daily chart. Although the breakout appeared strong and clean, the vertical volume bar that accompanied the move indicates that large-scale selling into strength was responsible for a sizable portion of the activity.
card
Instead of new institutional purchases, this is frequently an indication that larger players are using the rally to take profits or sell positions. Bitcoin runs the risk of making a lower high if it stays pinned below $120,000, which could weaken the current bullish momentum and pave the way for more significant corrections.
But there is a crucial disclaimer. A dense cluster of leveraged long positions stacked between $112,000 and $118,000 is visible in exchange order books and on-chain data. These areas are probably going to provide solid support because liquidation cascades tend to draw aggressive buyers protecting their entries, even though they can force short-term wicks.
This indicates that although sentiment is a little shaky following the unsuccessful push to $125,000, Bitcoin is unlikely to crash through those support levels without a fight. Although the RSI is still high at 69, it is not yet in the extreme overbought range. Bulls will have an opportunity to reorganize as long as Bitcoin stabilizes and consolidates above $115,000-$118,000.


