Kaspa price is starting to look strong again after bouncing off its $0.060 support zone. Over the past few days, the price has worked its way back to the top of a familiar range
Kaspa is knocking on the door of a key resistance level, $0.096. Whether or not it can break through will likely set the tone for what’s next. The token has been stuck in a wide range between $0.060 and $0.096 since May.
Now, it’s testing both the upper end of that box and a descending trendline that’s been holding it back since the May high. If bulls manage to push through, we could see Kaspa price stretch toward $0.10 or even $0.12.
What We Got Right Yesterday
In yesterday’s prediction, we mentioned that a close above $0.090 could open the door to $0.098, maybe even $0.11 if momentum stayed strong.
Sure enough, KAS price climbed as high as $0.096 during the session, just shy of breaking out. Support near $0.060 remains solid and continues to act as the foundation for this move.
We also pointed out that if it couldn’t clear resistance, price might drift sideways between $0.080 and $0.090. That range is still very much in play if the breakout doesn’t stick.
Kaspa Daily Overview (July 17)
Current Price: $0.0923
24h Change: +5.58%
4H RSI: 65.81
Volume: Steady with a slight uptick
Kaspa price is pushing into resistance, but we haven’t seen a confirmed breakout yet. Price needs to close above the $0.096–$0.10 zone to truly break free.
What the Kaspa Chart Telling Us
The daily KAS chart shows a big sideways range from $0.060 to $0.096. After forming a rounded bottom between June and early July, price has climbed steadily toward the top of the box.
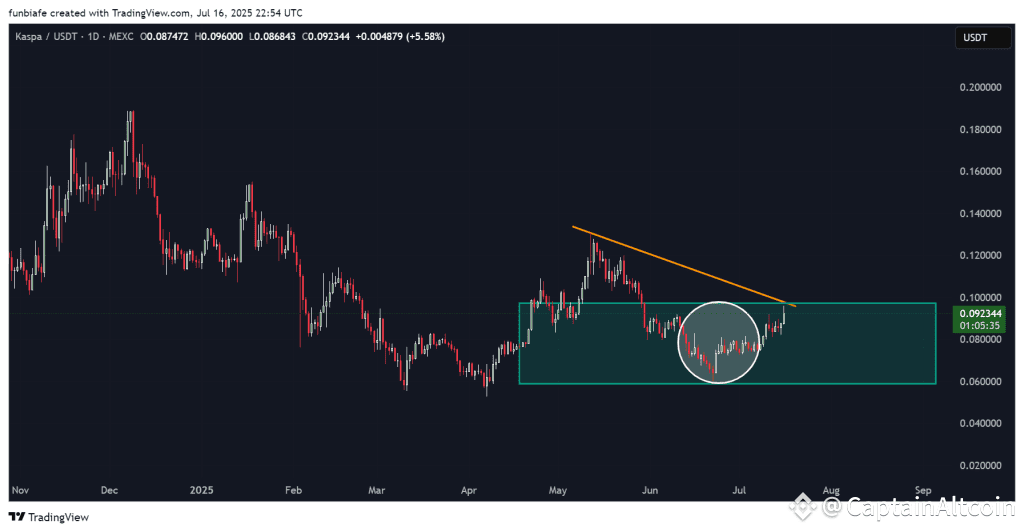 Source: TradingView.com
That rounded structure suggests buyers have been quietly accumulating, and now they’re making a move. The next challenge is breaking the orange trendline that’s capped every rally since May. No breakout yet, but pressure is building.
Technical Indicators (Daily Timeframe)
Indicator Value What It Means RSI (14) 65.81 Strong momentum, not overheated MACD (12,26) 0.002 Bullish crossover in progress CCI (14) 154.82 Buyers firmly in control Ultimate Oscillator 54.90 Positive across multiple timeframes ROC 18.91 Price rising sharply Bull/Bear Power 0.0148 Bulls still have the edge
Summary: Every major indicator is flashing buy. Momentum’s there, and nothing looks overheated yet. Bulls are in charge.
What to Watch for Today
Bullish Scenario:
If KAS can close above $0.096, it could pop toward $0.10 or even $0.12. That would confirm the breakout.
Neutral Scenario:
If KAS price stalls again below resistance, expect more sideways chop between $0.080 and $0.096 until something stronger develops.
Bearish Scenario:
If price slips back under $0.080, bears could regain control. That might bring $0.075 or even $0.066 back into focus.
Final Thoughts
Kaspa price is right at the edge of a breakout, but it’s not there yet. Bulls have made a solid push, and the indicators all support more upside, but the daily close will be the deciding factor.
All eyes are on the $0.096 level. A clean break could trigger the next move up, but if it fails again, we may see more sideways action.
Read Also: Here’s Why Kaspa (KAS) Could Benefit Big From the CLARITY Act
Subscribe to our YouTube channel for daily crypto updates, market insights, and expert analysis.
The post Kaspa (KAS) Price Prediction For Today (July 17) appeared first on CaptainAltcoin.
