

Bitcoin moved down from $138K to $117K and now sits near the support zones of $115K and $113K.
RSI cooled from a high reading and currently signals neutral strength as the market seeks fresh momentum.
Fibonacci zones at $115K and $113K have held firm and now traders expect a bounce toward $124K or higher.
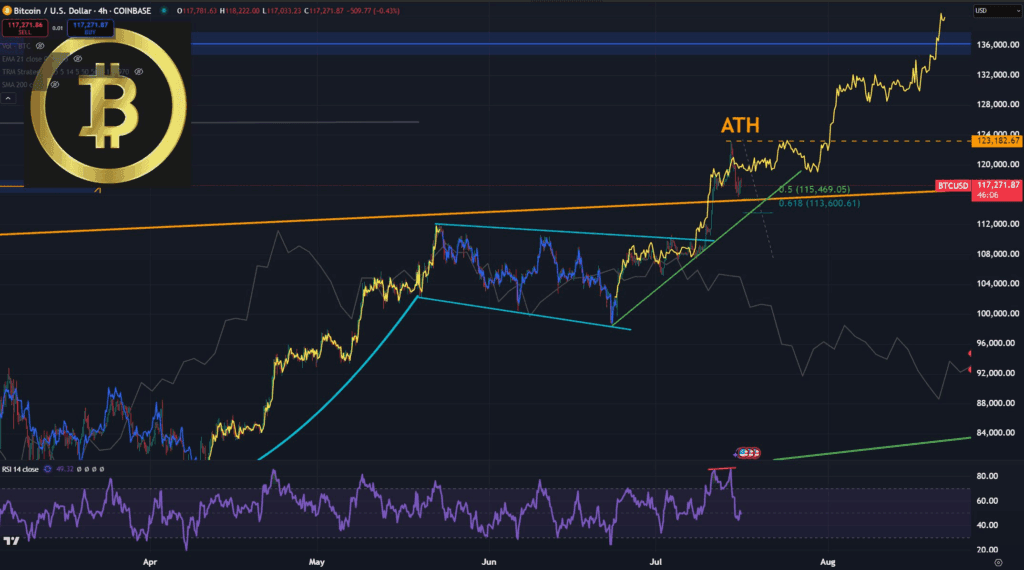
Bitcoin has dropped to $117,271 after hitting a fresh all-time high near $138,000, showing signs of a short-term technical pullback. Analysts say the pullback aligns with the 0.5 and 0.618 Fibonacci retracement zones around $115,469 and $113,600 respectively. Momentum on the Relative Strength Index (RSI) also hints at a cool-off following an overbought reading.
 Source: X Short-Term Correction as Long-Term Breakout Gets Retested
Bitcoin surged through a long-term resistance, marked by the thick orange line, before consolidating below $124,000. That area now acts as a retest zone, aligning with Fibonacci levels commonly used to gauge short-term corrections. This setup is supported by comments from trader TommyJR who said BTC “had a spicy meal” and now faces short-term digestion.
The retracement aligns with prior breakout zones around $124,000 to $120,000, with prices finding support around $115,469. Price action remains above the 0.5 Fibonacci level, which historically holds during bullish corrections. Traders are watching closely to see if the $113,600 level—being the 0.618 zone—will act as a floor if price dips further.
Momentum indicators like the RSI have retreated from overbought levels. The RSI last recorded a value near 49.32, which signals neutral momentum and offers room for another leg higher if buyers return. The current structure still aligns with a long-term bullish trend despite the temporary downturn.
All-Time High and Market Behavior Point to Accumulation Zone
The breakout above the all-time high occurred shortly after Bitcoin exited a descending channel, represented by a cyan structure. That breakout initiated a sharp rally, which pushed the price above $138,000. The area near $123,182, once resistance, is now viewed as a critical support in this structure.
This breakout carried strong buying momentum and caused short-term exhaustion. TommyJR noted that BTC has already dropped to the 38% retracement of the most recent move, indicating a healthy reset. Analysts have identified the area between $115,000 and $120,000 as a high-volume accumulation zone.
The current support structure also aligns with the ascending green trendline drawn from June. Bitcoin continues to respect this trendline, showing strong demand beneath the $120,000 mark. A breakdown below this area would be required to shift sentiment toward bearish territory.
The black shadow chart—possibly tracking futures open interest or macro correlation—also declined in sync, signaling cooling sentiment across related instruments. RSI’s divergence at the top added to the probability of a short-term pullback. Market structure still leans bullish unless these support levels break decisively.
Can Bitcoin Sustain the Rally After Retesting Breakout Levels?
With Bitcoin trading just above $117,000, analysts are watching if support holds above $115,469. This zone overlaps with the 0.5 Fibonacci level and is often a common bounce point in upward trends. If buyers defend this area, BTC could resume its uptrend toward retesting the $138,000 high.
The orange long-term trendline that was once resistance now serves as a baseline for evaluating strength. Price action above that trendline confirms macro bullish continuation. The upward curve drawn since May signals a stair-stepping rally that remains valid unless structurally broken.
Traders are now looking at RSI trends and consolidation behavior for signs of the next move. If accumulation continues near these support zones, Bitcoin may gain momentum again. The focus now shifts to the resilience of these support zones. Will Bitcoin rebound strongly from this pullback or is a deeper correction incoming?
