
🔍 Chart Overview & Pattern Analysis
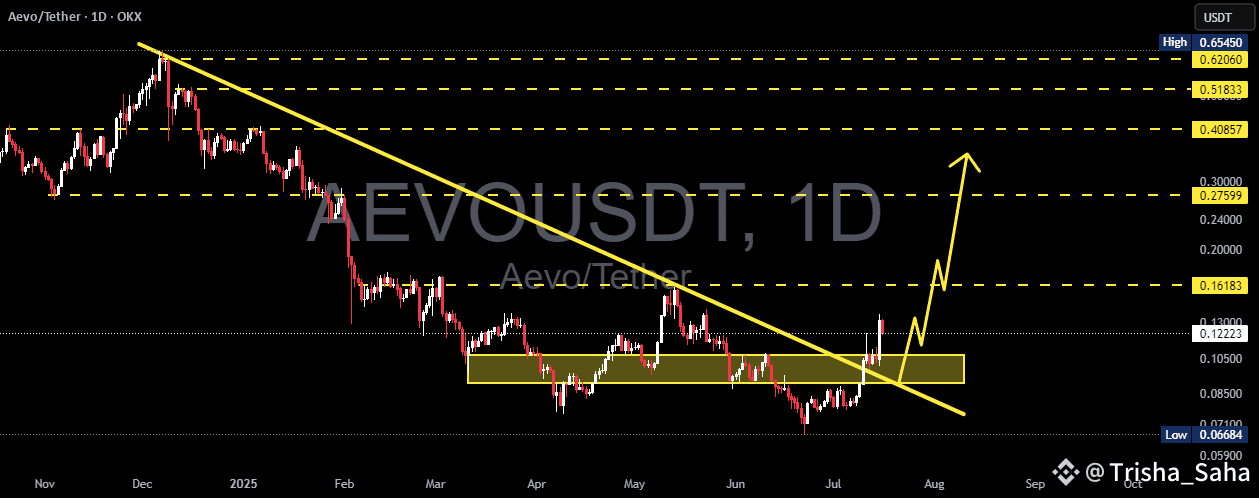
The AEVO/USDT daily chart reveals a significant breakout from a long-term descending trendline that has been intact since November 2024. This trendline acted as a strong dynamic resistance, suppressing every bullish attempt—until now.
A clear multi-month accumulation zone is visible between $0.080 – $0.105 (highlighted in yellow). Price tested this support zone multiple times, forming a strong base of demand. The combination of horizontal support and descending resistance creates a classic descending triangle breakout, often signaling a trend reversal when broken to the upside.
What's more, price action recently:
Broke above the trendline with strong bullish candles
Retested the breakout zone successfully
Is now forming a potential bullish continuation structure (mini bull flag or pennant)
This structure suggests that the bulls are not done yet—and momentum could be accelerating.
🟢 Bullish Scenario – The Path to Higher Highs
If AEVO continues to hold above the breakout zone, the following upside targets become very realistic:
✅ Target 1: $0.16183 – Previous resistance zone, short-term TP.
✅ Target 2: $0.27599 – Key horizontal resistance from late Q1 2025.
✅ Target 3: $0.40857 – Weekly structure resistance.
✅ Target 4: $0.51833 – Bullish extension zone.
🎯 Ultimate Bull Target: $0.62660 – Full recovery to pre-downtrend levels.
Confluence factors supporting this bullish outlook:
Breakout above dynamic and static resistances
Accumulation breakout after long consolidation
Higher low and bullish retest pattern
Bullish momentum building with volume confirmation (volume not shown but implied)
🔴 Bearish Scenario – Key Levels to Watch
In case of a false breakout or macro weakness:
Breakdown below $0.105 could invalidate the bullish structure
Price could revisit $0.080 or even $0.06684 (last line of defense)
A daily close below this zone would shift the bias back to bearish or neutral
However, as long as price stays above the yellow support box, the bullish thesis remains valid.
---
🧠 Key Technical Highlights
Pattern: Descending Triangle Breakout + Accumulation Base
Trend Shift: From Bearish to Bullish (confirmed with breakout + retest)
Momentum: Building up toward higher time frame resistances
Market Psychology: Smart money likely accumulated during sideways chop
📣 Final Thoughts
AEVO/USDT is showing one of the cleanest breakout structures in the altcoin space right now. With clear upside targets, a retested breakout zone, and strengthening market structure, this could be the early phase of a major bullish leg.
Traders and investors should watch for confirmation of higher highs and pullbacks to the $0.105 zone for potential entries.
#AEVOUSDT #CryptoBreakout #TrendReversal #AltseasonReady #DescendingTriangle