
📌 Chart Overview:
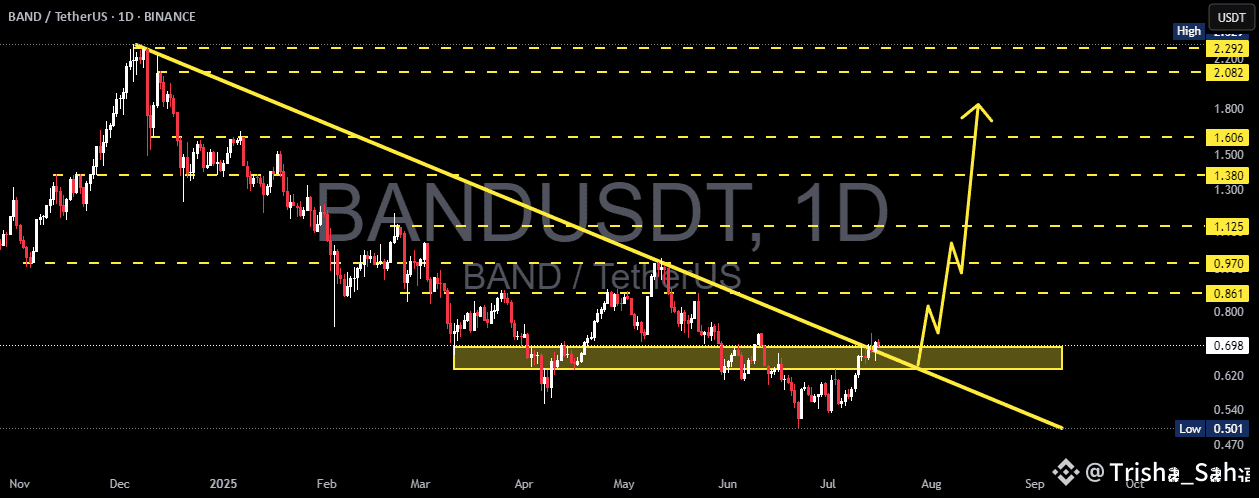
BAND/USDT has officially broken out from a long-term descending trendline that has suppressed price action for over 7 months. This breakout, confirmed with a bullish daily close above a key horizontal resistance zone ($0.68–$0.70), opens the door for a powerful trend reversal.
The structure signals the end of accumulation and the beginning of a potential markup phase, where volatility and volume often expand rapidly.
🔍 Technical Pattern Breakdown:
Falling Wedge Formation: A classic bullish reversal pattern formed after a prolonged downtrend. The wedge narrowed price volatility and concluded with a clean breakout to the upside.
Descending Trendline Breakout: The break of the major trendline marks a shift in control from bears to bulls. Historically, this is one of the strongest technical signals for a trend reversal.
Demand Zone Validation: The $0.60–$0.70 range has acted as a multi-month accumulation zone, with repeated rejections from the downside showing strong buyer presence.
✅ Bullish Scenario:
If BAND holds above the $0.68–$0.70 breakout zone, a strong bullish rally could unfold with the following upside targets:
1. TP1: $0.861 – Minor resistance, potential retest level.
2. TP2: $0.970 – Psychological resistance and historical flip zone.
3. TP3: $1.125 – Major horizontal resistance; a breakout from here could trigger FOMO buying.
4. TP4: $1.380–$1.606 – High-confluence zone from previous consolidation.
5. TP5: $2.08–$2.29 – Ultimate extension target aligned with macro resistance from November 2024 highs.
Each breakout above the target levels could lead to a short squeeze scenario, accelerating momentum.
⚠️ Bearish Scenario:
A failure to sustain above the $0.68–$0.70 level would invalidate the breakout and trap late buyers.
Breakdown back below the yellow zone could push price towards:
$0.60 – Key mid-support
$0.501 – The lowest support on chart; a break here would resume the downtrend.
Watch for volume divergence or fake-out signals on lower timeframes.
🧠 Market Psychology Insight:
This setup reflects a shift in sentiment. After a prolonged phase of apathy and seller exhaustion, smart money appears to be stepping in. The strong rejection from lows and breakout suggests early-stage bullish accumulation transitioning into public participation.
If volume increases along with upward price movement, it may confirm Phase C-D of a Wyckoff Accumulation, suggesting much higher upside.
📆 Timing Note:
Historically, July–September has offered volatility surges across mid-cap altcoins. With BAND breaking structure at this critical timing, early positioning could offer asymmetrical risk-reward.
#BANDUSDT #CryptoBreakout #AltcoinSeason #TrendlineBreakout #BTC120kVs125kToday