

MARA completed a three-month pattern and added 6.99 points from its confirmed weekly breakout formation.
After a clean bullish setup, the price climbed from the $10.50 range to close near $20.91.
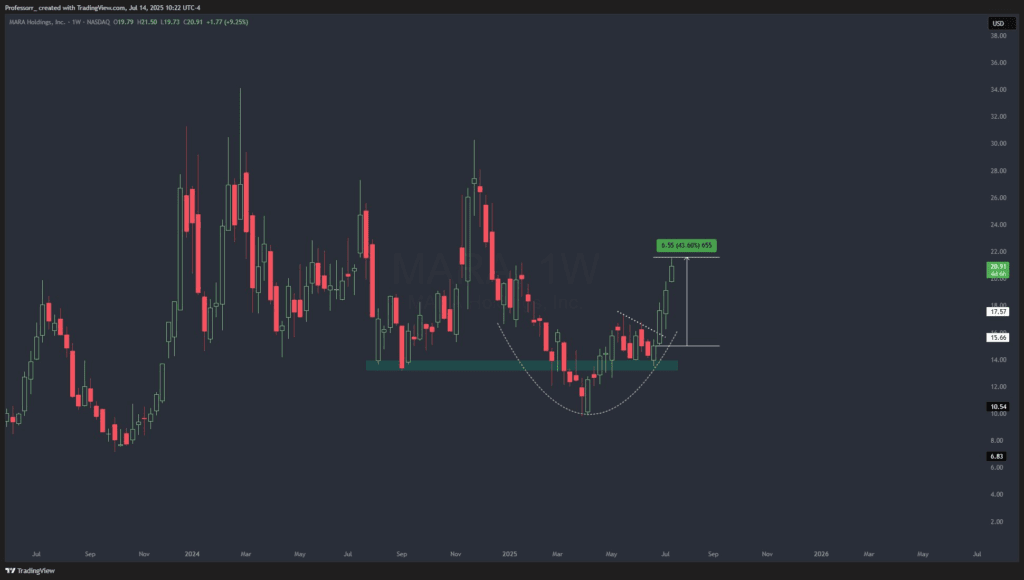
A measured move of the cup pattern set a breakout target that closely aligned with the $22 zone.
MARA Holdings Inc. surged 43.03% over three weeks, reaching $20.91 after breaking out from a bullish cup pattern on the weekly chart. The breakout followed a key support bounce around $10.50 and aligned with a predicted upside target near $22.00. The chart setup, shared publicly by an analyst, unfolded without hidden signals or private access.
 Source: X
The move confirmed a textbook cup formation, with a well-defined rounded bottom and controlled breakout above neckline resistance. Price action remained stable throughout the setup phase, forming higher lows as momentum built up. Traders responded after MARA cleared the mid-resistance zone and closed above the previous local highs.
The breakout candle carried volume and closed well above the breakout level. The move came just two weeks after an alert was posted on June 30, calling MARA “ready at the runway and ready for launch.” As of July 14, the forecasted zone was exceeded by 13% more than expected.
Chart Formation Signals Strength as Breakout Surpasses 30% Projection
The weekly chart shows MARA forming a rounded base between April and June 2025, with tight consolidation above historical support. This support zone spans between $8.81 and $10.51 and was retested multiple times over a 90-day period. After that, the price gradually formed the right handle of the cup and breached the neckline.
From the breakout point, MARA jumped $6.29, equating to a 43.03% increase from the base. The cup-and-handle pattern is widely followed by technical analysts due to its reliability in bull markets. The pattern's depth and duration often define the magnitude of the breakout, and in this case, both metrics aligned.
The projected target near $22.00 is based on a measured move from the bottom of the cup to the neckline resistance. A vertical move of equal height was plotted above the breakout point. The result landed in the $22.00 area, which the price approached before showing minor intraday rejection.
Public Analyst Call Matches Pattern and Community Reaction Is Instant
The chart was shared by market analyst Prof (@Prof.heist), who previously posted a June 30 signal calling a “nearest stop 30% out.” The stock exceeded that projection, gaining an additional 13% above expectations. The move led to viral traction across social media, with over 30,000 views and hundreds of reactions.
The analyst confirmed that no Discord or Patreon was needed to access the information. The trade idea and chart were published freely on X (formerly Twitter). The setup served as a public demonstration of technical charting applied to crypto-related equities.
This setup highlighted how a public chart pattern can influence trading momentum and sentiment across investor groups. The breakout occurred in line with institutional activity tracking bullish setups in crypto-aligned stocks. As sentiment rises with Bitcoin’s moves, equity plays like MARA continue to attract renewed attention.
