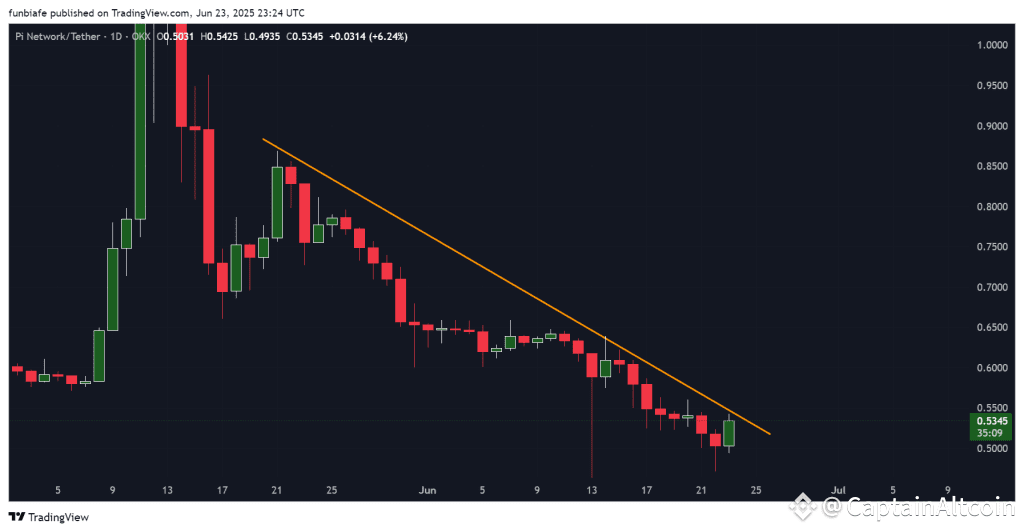
Pi Coin staged a modest bounce after testing support near $0.49, and gaining 6.24% on the day. The price closed at $0.5345, one of the few green candles in several weeks.
While the move shows some early buying interest, the broader trend remains downward. Pi Coin price is still stuck under the downward trendline that’s shut down every bounce since the end of May.
Even with the bounce, most technical indicators are still leaning bearish, only one is starting to show a bit of bullish momentum. Until key resistance levels are reclaimed, Pi Coin price remains in a vulnerable spot within its current downtrend.
Pi Coin Daily Overview (June 24)
Current Price: $0.5345
24h Change: +6.24%
Daily Range: $0.4935 – $0.5425
Volume: Unconfirmed, but increased candle size hints at a spike
Despite the bounce, Pi Coin price remains stuck below its falling trendline. Short-term buyers stepped in near $0.49, but without follow-through, the move could fade quickly.
What the Pi Coin Chart Is Showing
The Pi Coin chart still reflects a strong downtrend, with price forming a clear series of lower highs and lower lows. The orange trendline has rejected multiple rally attempts, and the most recent move hasn’t broken through.
 Source: TradingView.com
If Pi Coin price breaks above $0.57 and holds, it could make a move toward $0.60 to $0.62. But if it slips back under $0.50, there’s a good chance it could drop again and test the $0.47 to $0.48 area.
Technical Indicators (Daily Timeframe)
Indicator Value Signal / Interpretation MACD (12,26) -0.052 Bearish momentum still in control Ultimate Oscillator 55.238 Mild bullish sentiment from multi-timeframe view CCI (14) -83.0857 Bearish territory, approaching oversold levels RSI (14) 36.238 Weak momentum, not yet oversold ROC (Rate of Change) -15.804 Strong short-term downward pressure Bull/Bear Power (13) -0.0811 Bears still holding the advantage
Summary: Most indicators support the bearish trend, with the Ultimate Oscillator being the only one pointing to early buying interest.
Pi Coin Price Prediction Scenarios
Bullish Scenario:
A close above $0.57 with volume could flip trend sentiment and set up a rally toward $0.62.
Neutral Scenario:
If momentum slows down and volume stays low, Pi Coin price might just keep moving sideways between $0.50 and $0.56 for a while.
Bearish Scenario:
If Pi Coin slides back below $0.50, it might head down to retest the $0.47–$0.48 zone, and if selling picks up, it could slide even lower.
Read Also: Is Pi Network Living Up to the Hype? A Look at 100 Days of Open Mainnet
Wrapping Up
Pi Coin price remains stuck in a broader downtrend despite a temporary bounce. Buyers showed up near support, but sellers continue to control the key resistance levels.
Until price breaks above the $0.57 line, the setup favors continued sideways or downward movement. Traders are watching today’s close to determine whether the bounce continues or fades back into the trend.
Subscribe to our YouTube channel for daily crypto updates, market insights, and expert analysis.
The post Pi Coin Price Prediction For Today (June 24) appeared first on CaptainAltcoin.