
🚨 Disruption: Bearish Outlook
🔻 1. Lower High Pattern Forming
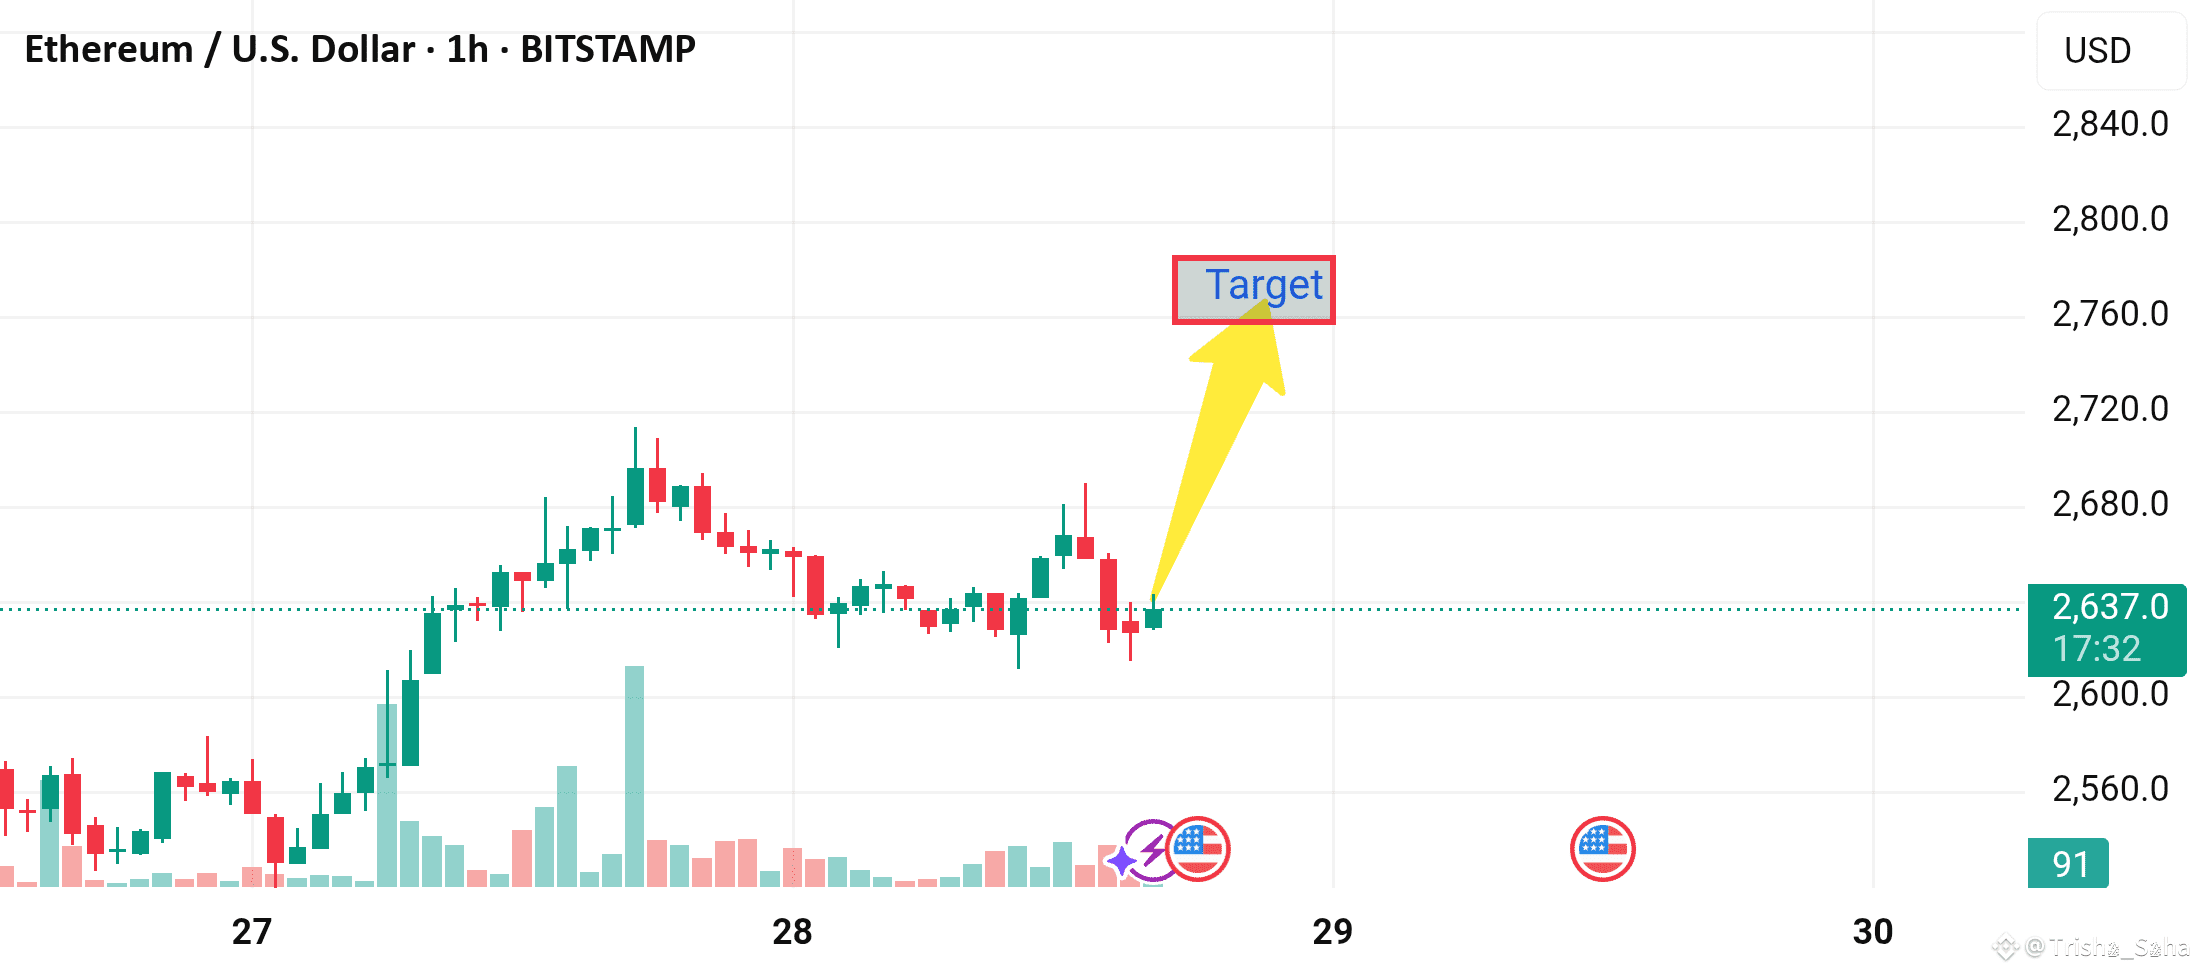
Price peaked earlier and has not made a new high. Instead, we’re seeing a flattening top. This could indicate distribution rather than continuation. A failure to break above ~$2,675 confirms a lower high.
🔻 2. Diverging Momentum
The price has moved sideways with decreasing volume, suggesting momentum is fading. Buyers may be losing interest, setting up for a reversal or sharp dip.
🔻 3. Bearish Candlestick Rejection
Recent candles show upper wicks, signaling selling pressure at highs. If this continues, the price may be forming a rounded top, not prepping for a breakout.
🔻 4. Potential Breakdown Zone
If ETH falls below the ~$2,620 support region, it opens the door to $2,580 or even $2,540, especially ahead of upcoming economic events (marked on the chart) which may spook risk markets.
🔻 5. Liquidity Trap Risk
This small bounce could be a liquidity trap—pulling in long traders before reversing sharply. This tactic often happens ahead of volatility spikes