Key Takeaways:
Bitcoin consolidation below $120K forms a classic bull pennant pattern, signaling a possible breakout to $136K–$140K.
Short-term pullback to $115K remains on the table as bulls prepare for the next leg higher.
Technical analysts identify additional bullish formations, including inverted head-and-shoulders and golden cross.
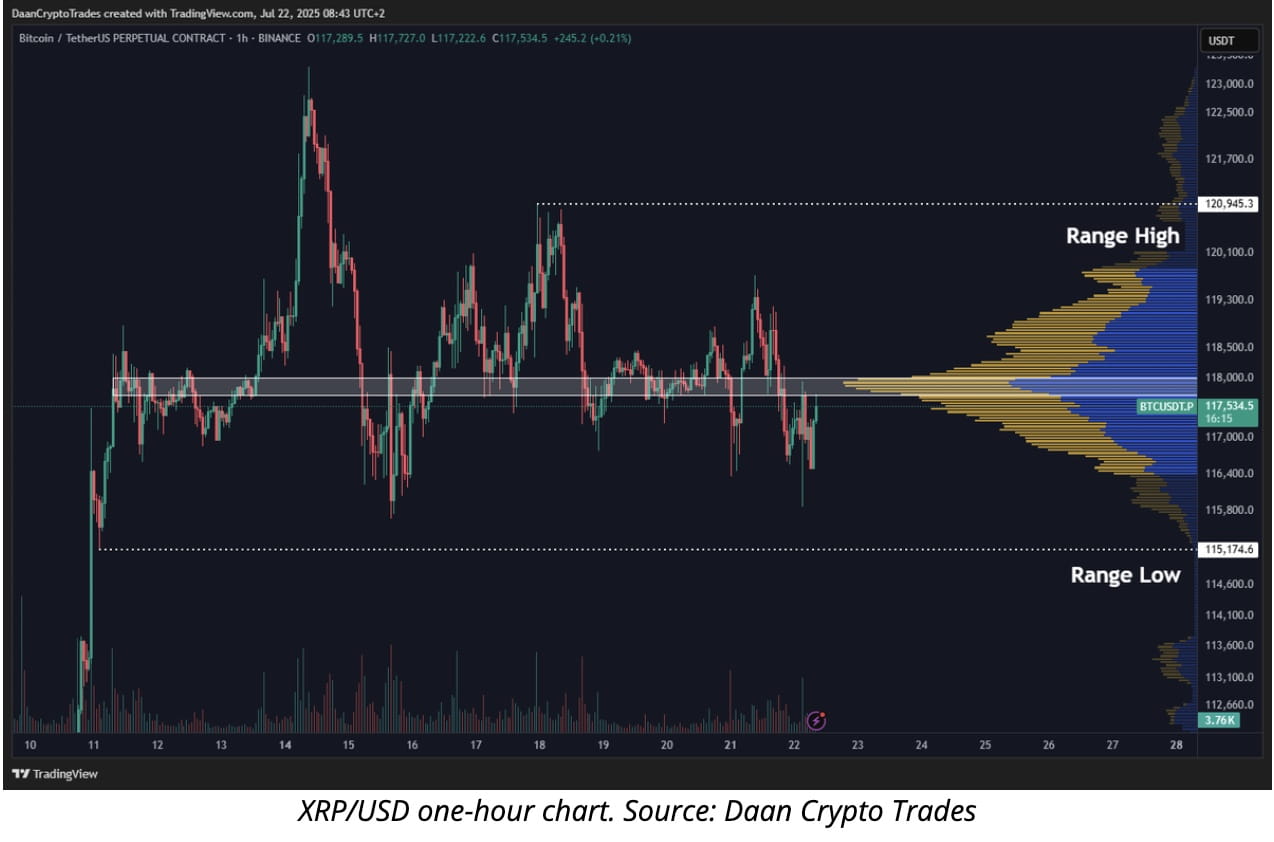
Bitcoin trades at $118,021 as of writing, with volume concentration around the $118K level.
Bitcoin Price Poised for Breakout Above $136K as Bull Pennant Forms
Bitcoin (BTC) is consolidating just below $120,000 after reaching a new all-time high of nearly $123,000 on July 13. According to multiple crypto analysts, this pause in momentum may be a bullish continuation pattern, with Bitcoin now trading inside a bull pennant — historically a signal of further upside.
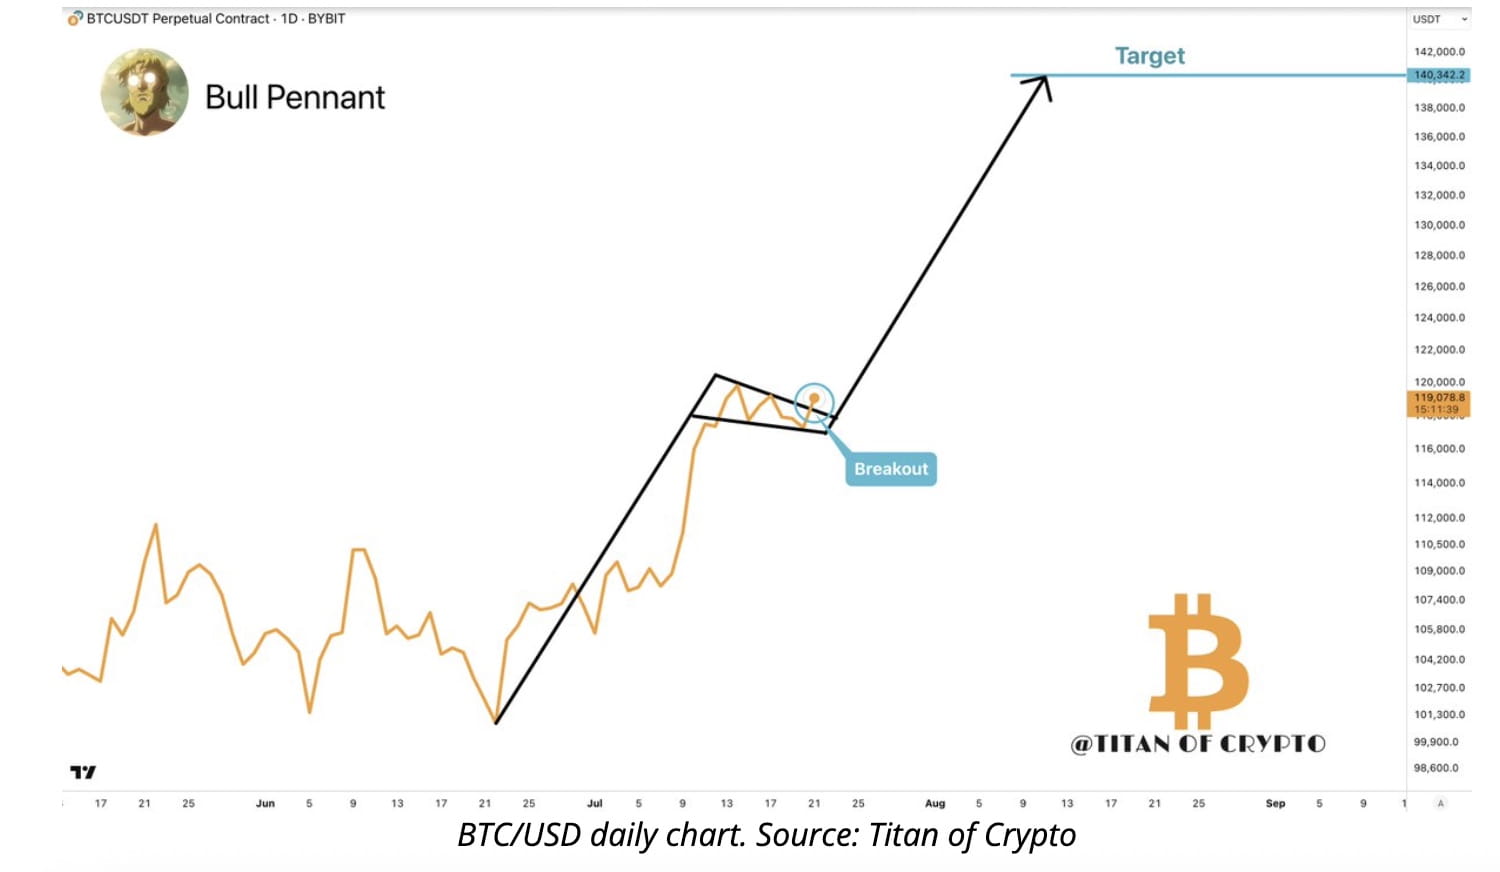
“Welcome to the final and most explosive phase of the bull run,” said Titan of Crypto in a Monday post on X, forecasting a move to $136,500 or higher if the pattern breaks to the upside.
A bull pennant typically appears after a sharp rally and signals continuation following a period of consolidation. The projected 15% move from current levels would place BTC in the $136,000–$140,000 range. Still, the historical success rate of this pattern stands at just 54%, making it moderately reliable.
Other Bullish Patterns Suggest Bitcoin Rally Still Has Legs
In addition to the bull pennant, other traders are highlighting bullish chart patterns that support a move to $140K and beyond:
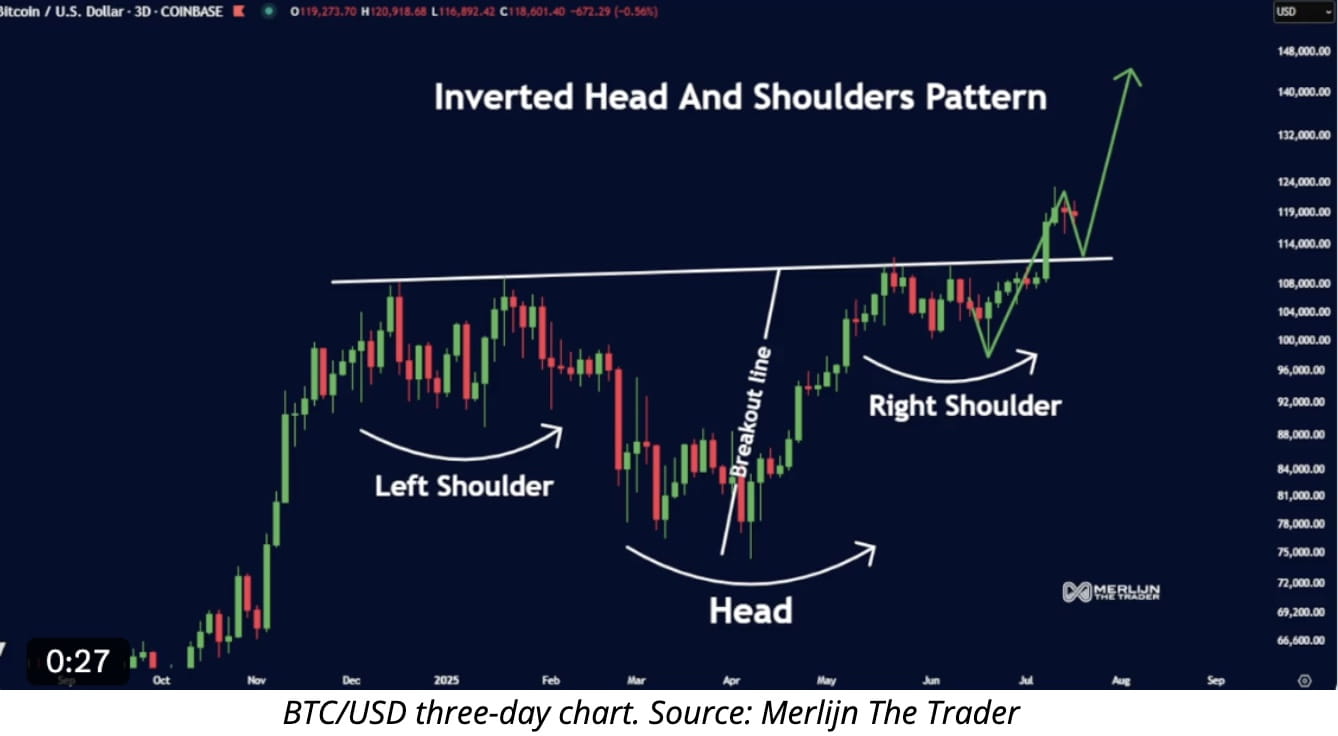
Merlijn The Trader noted an inverted head-and-shoulders breakout on the 3-day chart, also pointing to a measured target of $140,000.
Another analyst cited a golden cross on the daily chart suggesting a broader target of $155,000 if momentum continues.
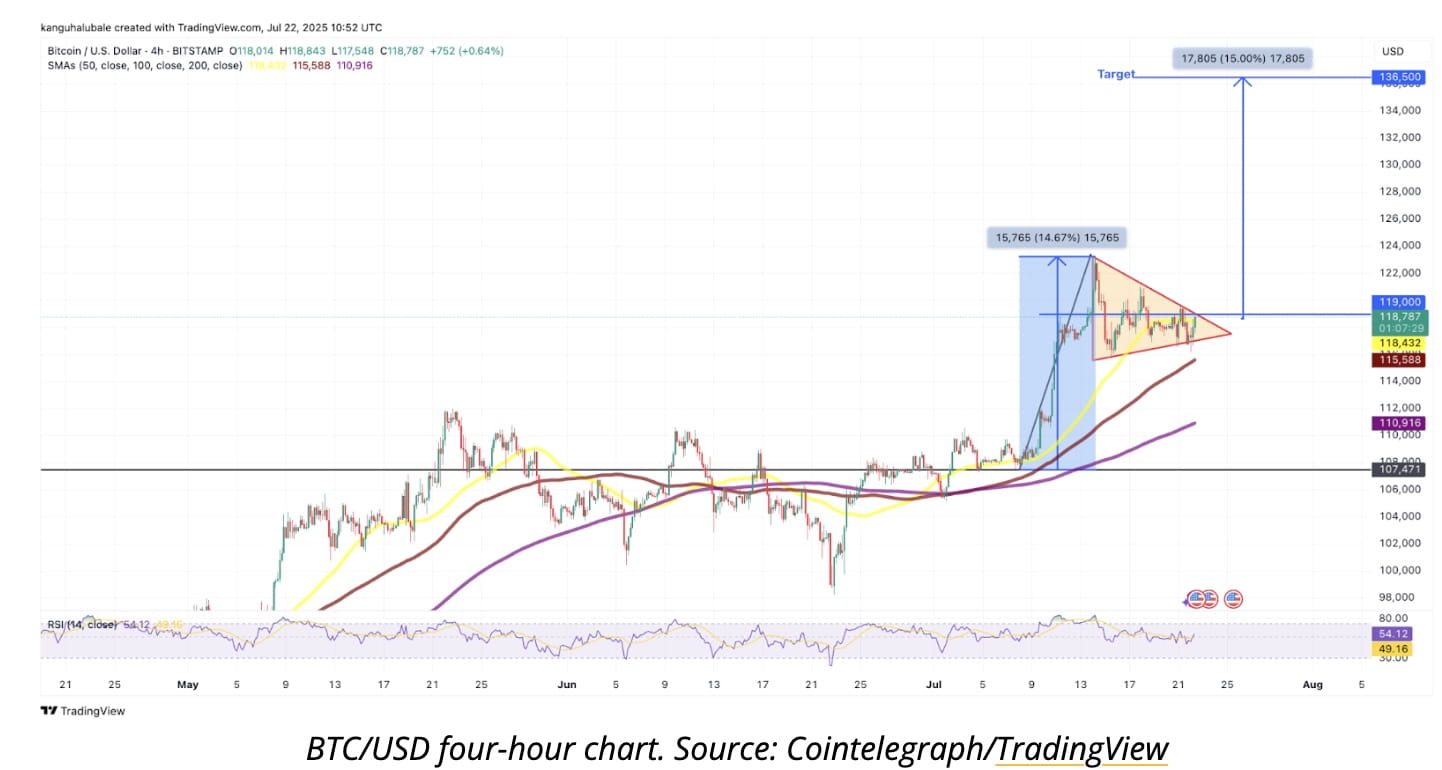
Marcus Corvinus, however, took a more conservative stance, pointing to a symmetrical triangle breakout that could push BTC to $125,000 in the short term.
Bitcoin Could Dip to $115K Before Next Leg Higher
Despite the bullish outlook, several analysts expect a short-term flush to support around $115,000 to shake out weak hands and gather fresh liquidity.
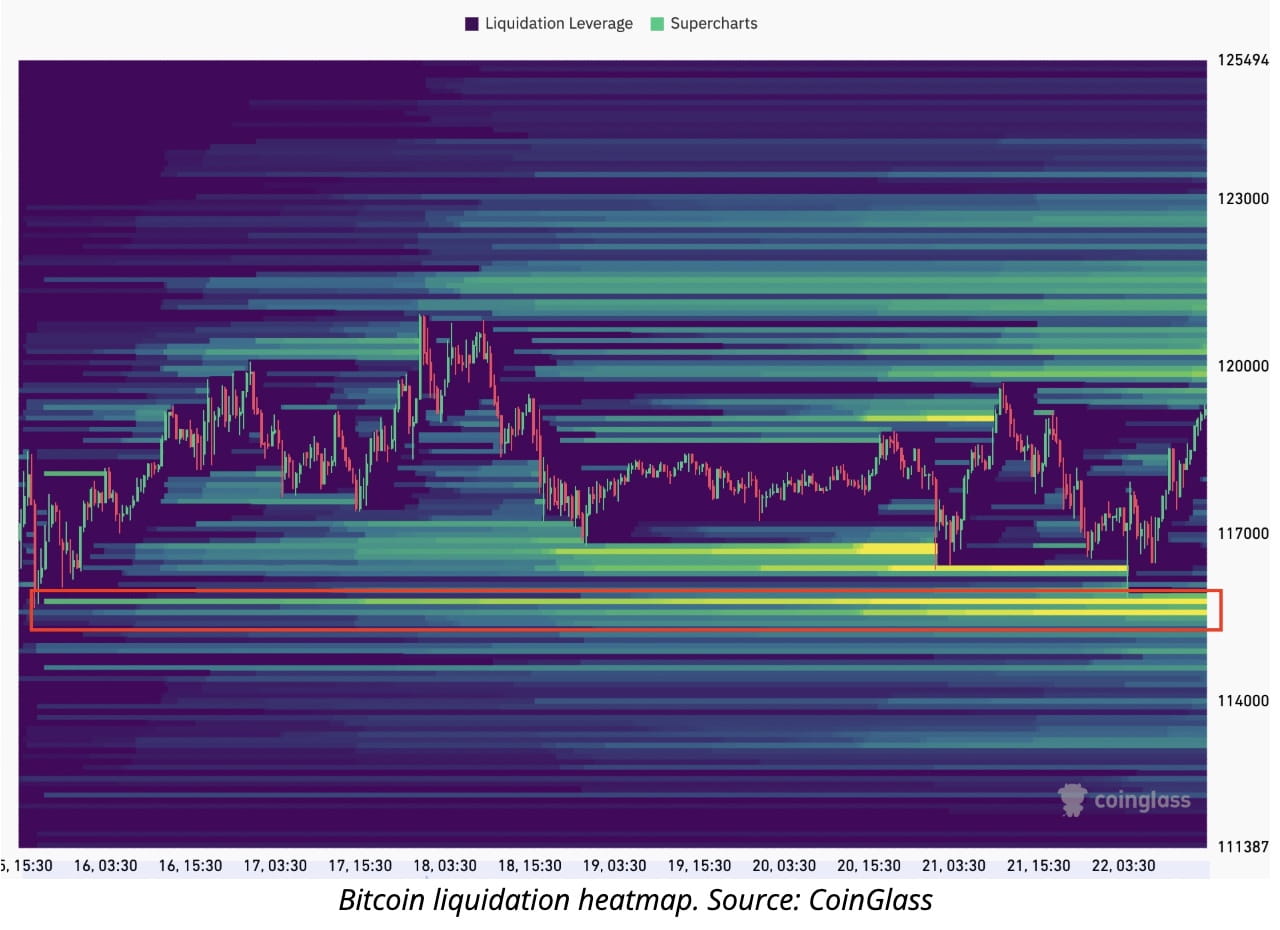
“A little lower and bulls will likely have the fuel needed to push higher once again,” said AlphaBTC, noting that bid clusters on the BTC liquidity map are stacking between $115,000 and $116,100.
Daan Crypto Trades also highlighted the current range between $115,000 (support) and $121,000 (resistance), urging traders to watch for a potential liquidity sweep before continuation.
BTC Price Overview and Outlook
Current price: $118,021
Support to watch: $115,000
Resistance to watch: $121,000–$123,000
Bullish targets: $125,000, $136,500, $140,000, and potentially $155,000
If Bitcoin confirms the bull pennant breakout and maintains structural support above $115,000, analysts agree the most aggressive leg of the rally may be near — one that could push BTC to fresh highs amid strong buyer absorption and favorable macro sentiment, according to Cointelegraph.