
📉 The weekend shows Solana struggling to regain traction, but the 4-Hour chart reveals a clear technical obstacle that the bulls must overcome.
Structure Analysis:
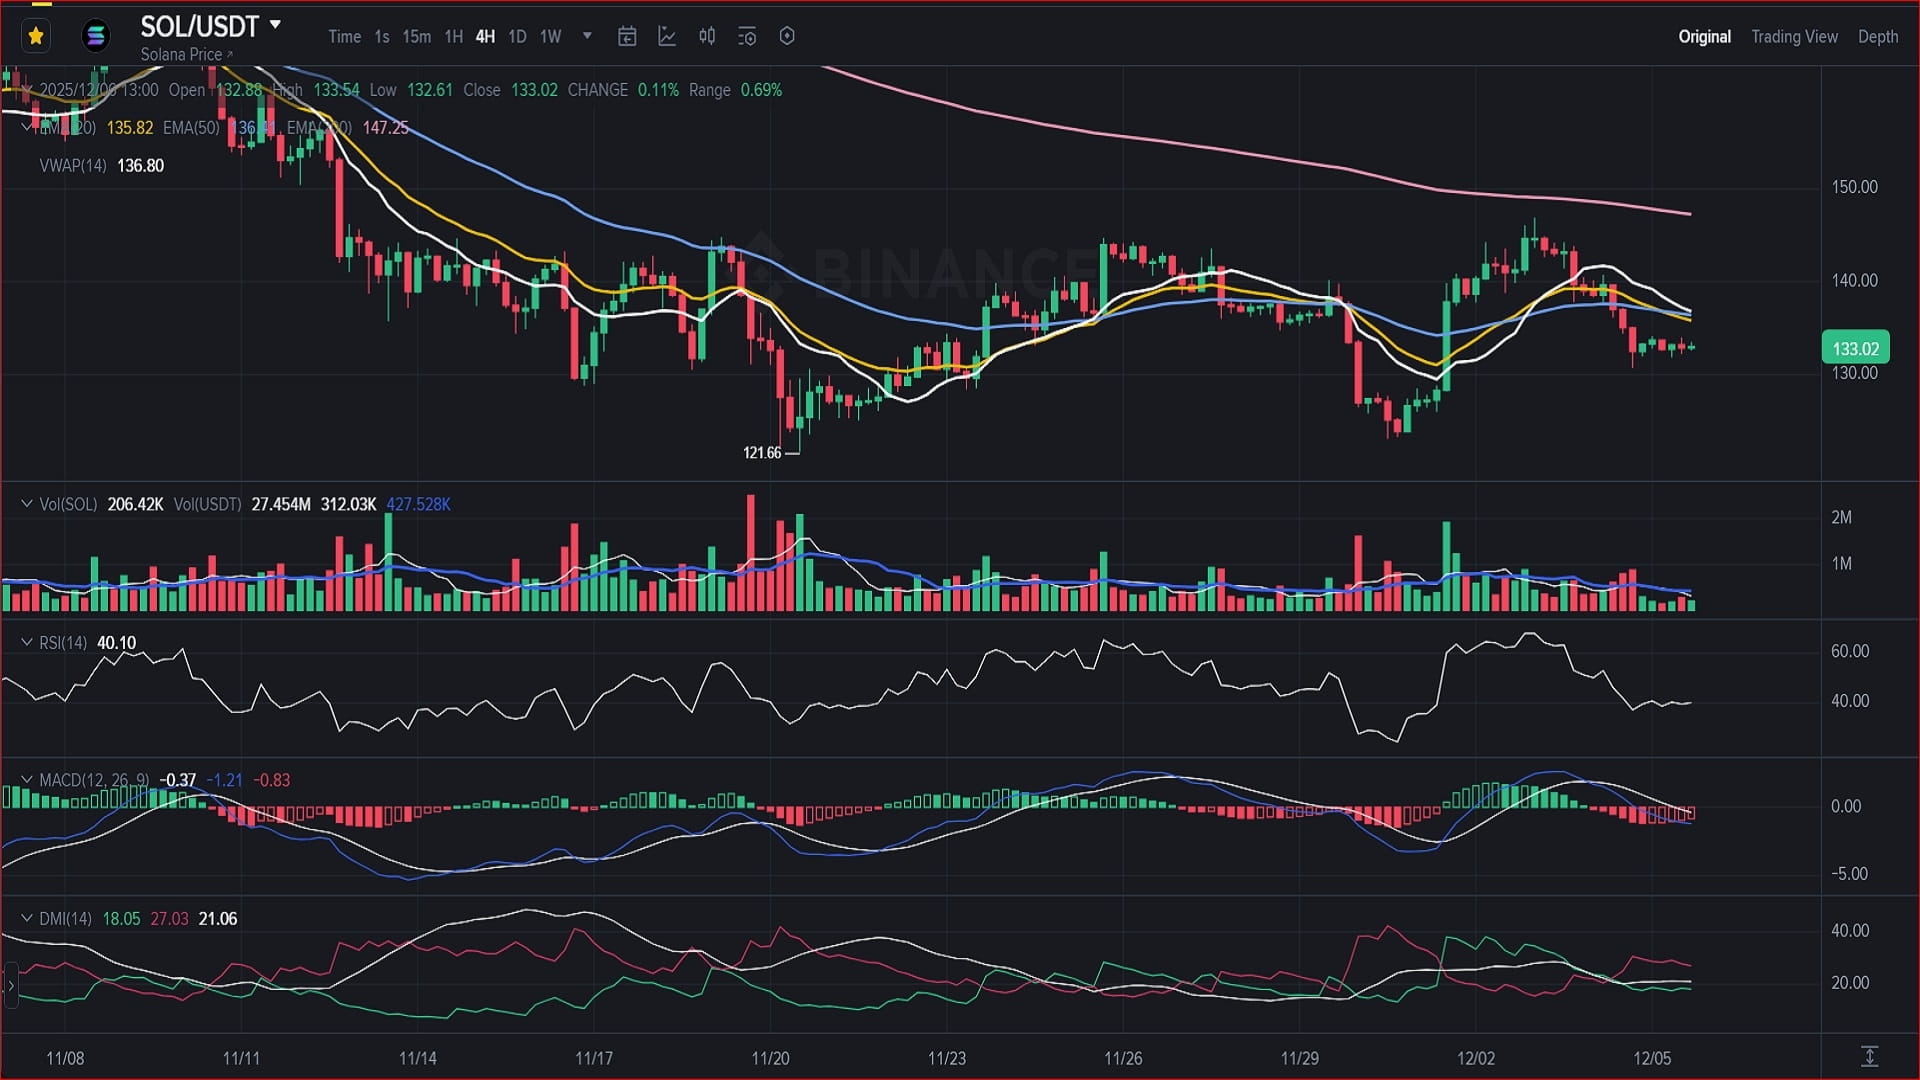
🚧 The Resistance Wall: The price ($133.02) is trading below the EMA 20 (Yellow Line) and the EMA 50 (Light Blue Line).
The Key Level: The zone of $136 - $137 is a wall. It coincides with the VWAP and moving averages. Until we break that level, the pressure is bearish.
⚠️ RSI at 40: The relative strength indicator does not show clear bullish divergences yet. It suggests that there could still be a test of the lower supports ($130) before any serious bounce.
My Strategy:
Patience. Entering now is guessing. The safe entry signal ("Long") would be a confirmed breakout with volume above $137. As long as we remain below, be cautious of "traps".
🇬🇧 English Summary:
SOL is currently trapped below key resistance levels on the 4H chart. The price is trading under the 20 EMA (Yellow) and 50 EMA (Blue), facing a tough wall at $136 - $137. RSI at 40 indicates weak momentum. Bulls need to reclaim $137 to confirm a reversal; until then, the bias remains cautious with potential tests of lower support at $130.
👇 Do you think SOL will defend $130 this weekend, or will we fall further?
#solana $SOL #TechnicalAnalysis #tradingStrategy #CryptoUpdate #BinanceSquare
⚠️ Disclaimer: This content is for educational and informational purposes only. It does not constitute financial advice. Do your own research (DYOR).
