💢💢💢IF YOU'RE GOING TO BUY, DON'T EXPECT SHORT-TERM PROFITS, THAT WON'T HAPPEN. ACCORDING TO TODAY'S CHART, THE TREND IS DOWN💢💢💢
✅ COMPLETE ANALYSIS OF BTC/USDT (15m)
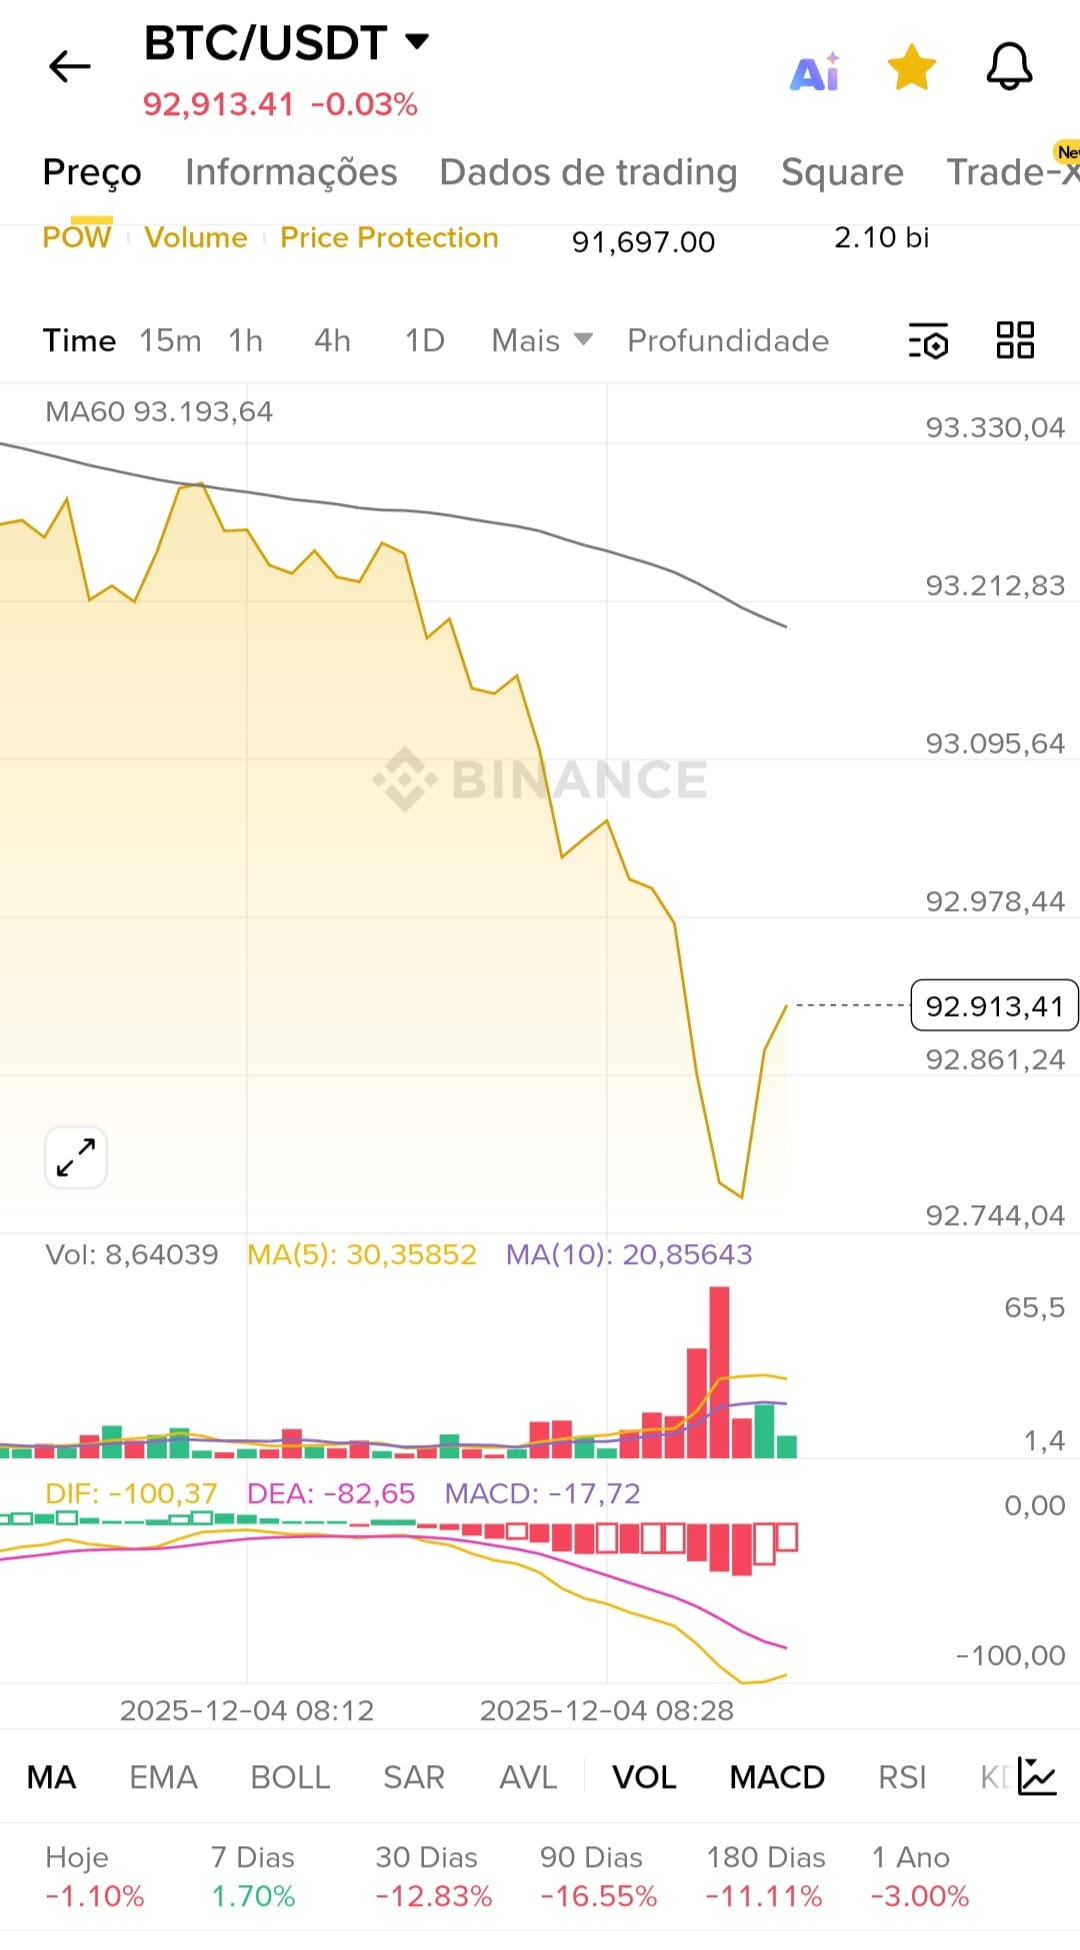
📉 1. Price Trend (Short Term)
The chart shows a strong continuous decline, with bearish candles dominating and forming:
Lower highs
Lower lows
Strong downward slope
This characterizes a clear downward trend in the short term.
Despite this, the price made a small bounce (pullback) after touching the zone ~92.744, forming a green recovery candle.
👉 The current movement is just a pullback within a downtrend — no confirmed reversal.
📊 2. Moving Averages (MA5 / MA10 / MA60)
MA60 (gray line) is above the price and falling → macro downtrend.
MA5 (yellow) is well below MA60 and pointing down.
MA10 (purple) is also sloping down.
This creates a classic scenario of:
🔻 "Alligator mouth opening" between MA5 and MA10 → strong bearish pressure.
No bullish crossover is being formed yet.
🔥 3. Volume (VOL)
The volume shows:
Several large red bars, confirming selling strength.
A gigantic peak of volume before the current recovery:
→ This high volume may mean:
Climax of selling (excess of sellers) OR
Final distribution before continuing to fall
The subsequent green candle shows buyer entry, but not enough to change the scenario.
📉 4. MACD — Strongly Bearish
Values:
DIF: -100.37
DEA: -82.65
MACD: -17.72
Interpretation:
MACD is in extremely negative territory.
DIF below DEA → downtrend continues.
Histogram bars are long and negative → strong selling pressure.
No signs of reversal (like crossover) at the moment.
Just a small decrease in the red bars → indicating a momentary loss of strength, but not a reversal.
📝 5. Important price levels
From the visible numbers:
Short resistance: 92.978
Strong resistance: 93.212 – 93.330 (where MA60 is located)
Tested support: 92.744
Important support: 92.700 – 92.600
If the region 92.700 is lost, there is a chance of a greater decline.